Routing graph
The Routing page, in the sidebar, draws your whole topology as a graph: exchanges, queues, the bindings between them, dead-letter routes and alternate exchanges. It is the fastest way to understand where a message goes once it is published.
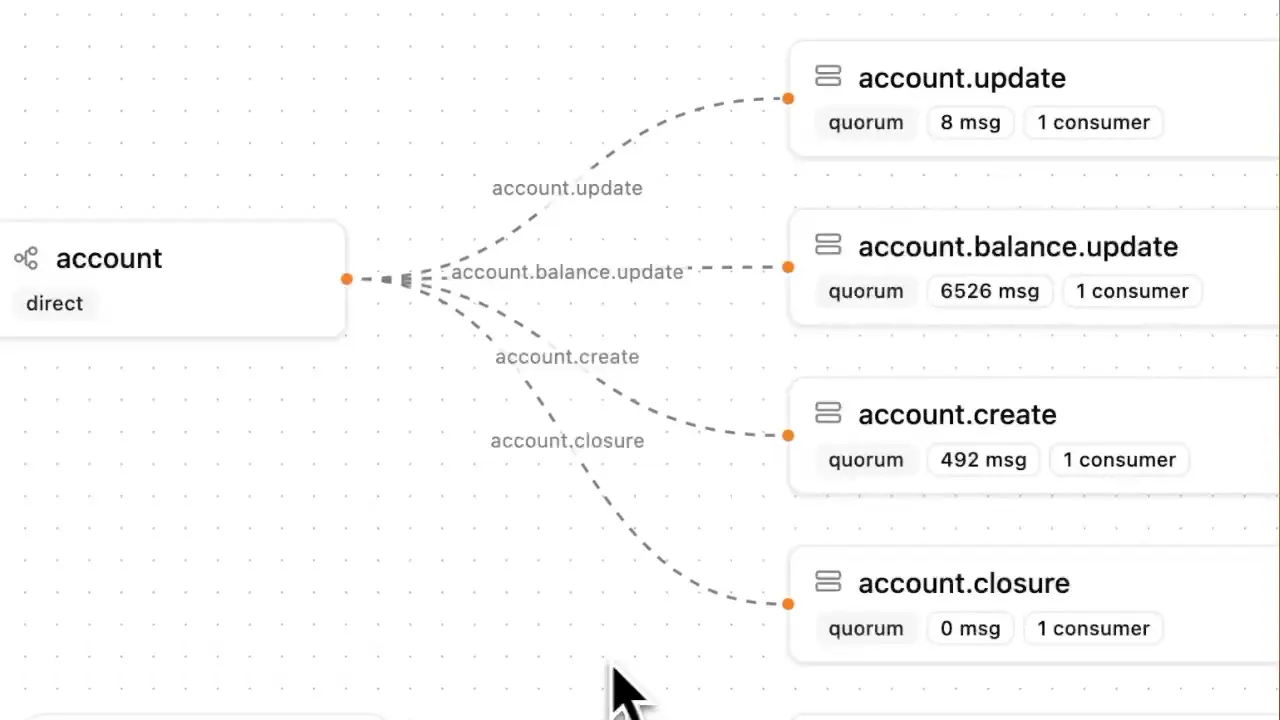
Reading the graph
- Nodes are exchanges and queues. The default exchange appears as (AMQP default).
- Bindings are animated edges from an exchange to a queue or to another exchange, labelled with their routing key.
- Dead-letter routes go from a queue to its dead-letter exchange, labelled DLX, with the dead-letter routing key when there is one.
- Alternate exchange routes go from an exchange to its alternate exchange, labelled Alternate.
- Consumer nodes show how many consumers read from each queue.
The layout is computed automatically, and the graph refreshes every 10 seconds. Hover a node to highlight everything connected to it and dim the rest. Use the controls in the corner to zoom and fit the graph to the screen.
Choosing what to show
The panel on the left lists every virtual host, with its exchanges and queues, and has its own search box. Use it to:
- Show or hide a virtual host, an exchange or a queue.
- Click an item to zoom the graph onto it and its descendants.
- Use only on an item to hide everything else.
- Toggle Default exchanges (hidden by default, since every queue is bound to the default exchange) and Consumers.
For the bindings of one queue or exchange in a table, use its Routing tab. The blog post how to visually explore RabbitMQ bindings walks through a full example.