The best RabbitMQ GUI clients and UIs (2026)
RabbitMQ ships with a web Management UI, but it was built for administration rather than day-to-day debugging. Here are the GUI tools developers actually use with RabbitMQ, what each one is good at, and where it falls short. We make RabbitGUI, so it is listed first, but every entry is described with the same criteria and sources.
Disclosure: we make RabbitGUI. Competitor facts are sourced at the bottom of the page.
How we compared them
- Can you look at messages without losing or reordering them?
- Can you find and replay failed or dead-lettered messages?
- How much setup does it need, and where does it run?
- What does it cost for one developer, and for a team?
Quick comparison
| Capability | RabbitGUI | Management UI | QueueExplorer | RabbitScout | RabbitMQ UI extension | rabbitmqadmin | Grafana |
|---|---|---|---|---|---|---|---|
| Browse messages safelyLook at the messages sitting in a queue without losing them or disturbing consumers. | YesCopies messages to a local store, with requeue or removal, then lets you inspect them at no cost to the broker | Partly"Get messages" consumes messages and optionally requeues them, which changes order and redelivery flags | YesProgressive loading with a configurable limit, streams by offset | PartlyPeek messages with pagination through the management API | PartlySame "Get messages" as the Management UI, with JSON formatting | Partly"get" consumes and optionally requeues, like the Management UI | No |
| Search & filter messagesFind specific messages by body, headers or properties instead of paging through them one by one. | YesSearch and filter extracted messages | NoNo message search or filtering | YesFilter loaded messages, Professional extracts values with JSON, XPath or regex | PartlySorting of peeked messages | No | NoPipe the output to grep or jq | No |
| Replay dead lettersRe-publish failed or dead-lettered messages back to a queue or exchange. | YesRepublish selected messages anywhere, with throttling | PartlyOnly with the shovel plugin ("Move messages"), whole queue at a time | YesInspect dead-letter headers and replay | Not documented | No | PartlyScriptable by hand | No |
| Watch live trafficSee messages as they flow through a queue without consuming them. | YesNon-destructive spy using a temporary shadow queue | No | Not documented | Not documented | No | No | No |
| Visual routing graphSee how exchanges, bindings, dead-letter and alternate exchanges connect. | YesInteractive graph including dead-letter and alternate exchanges | PartlyBindings listed per exchange or queue, no graph | Not documented | PartlyInspect and add bindings, no graph | No | No | No |
| Many brokers in one placeSwitch between local, staging and production brokers without re-entering credentials. | YesOne-click switching | NoOne broker per browser tab, log in to each | YesServers organized in groups | NoOne broker per deployment | No | PartlyNamed nodes in a config file | YesMany clusters in one Grafana |
1. RabbitGUI
Desktop app · macOS, Windows, Linux · 29€ one-time, free updates forever
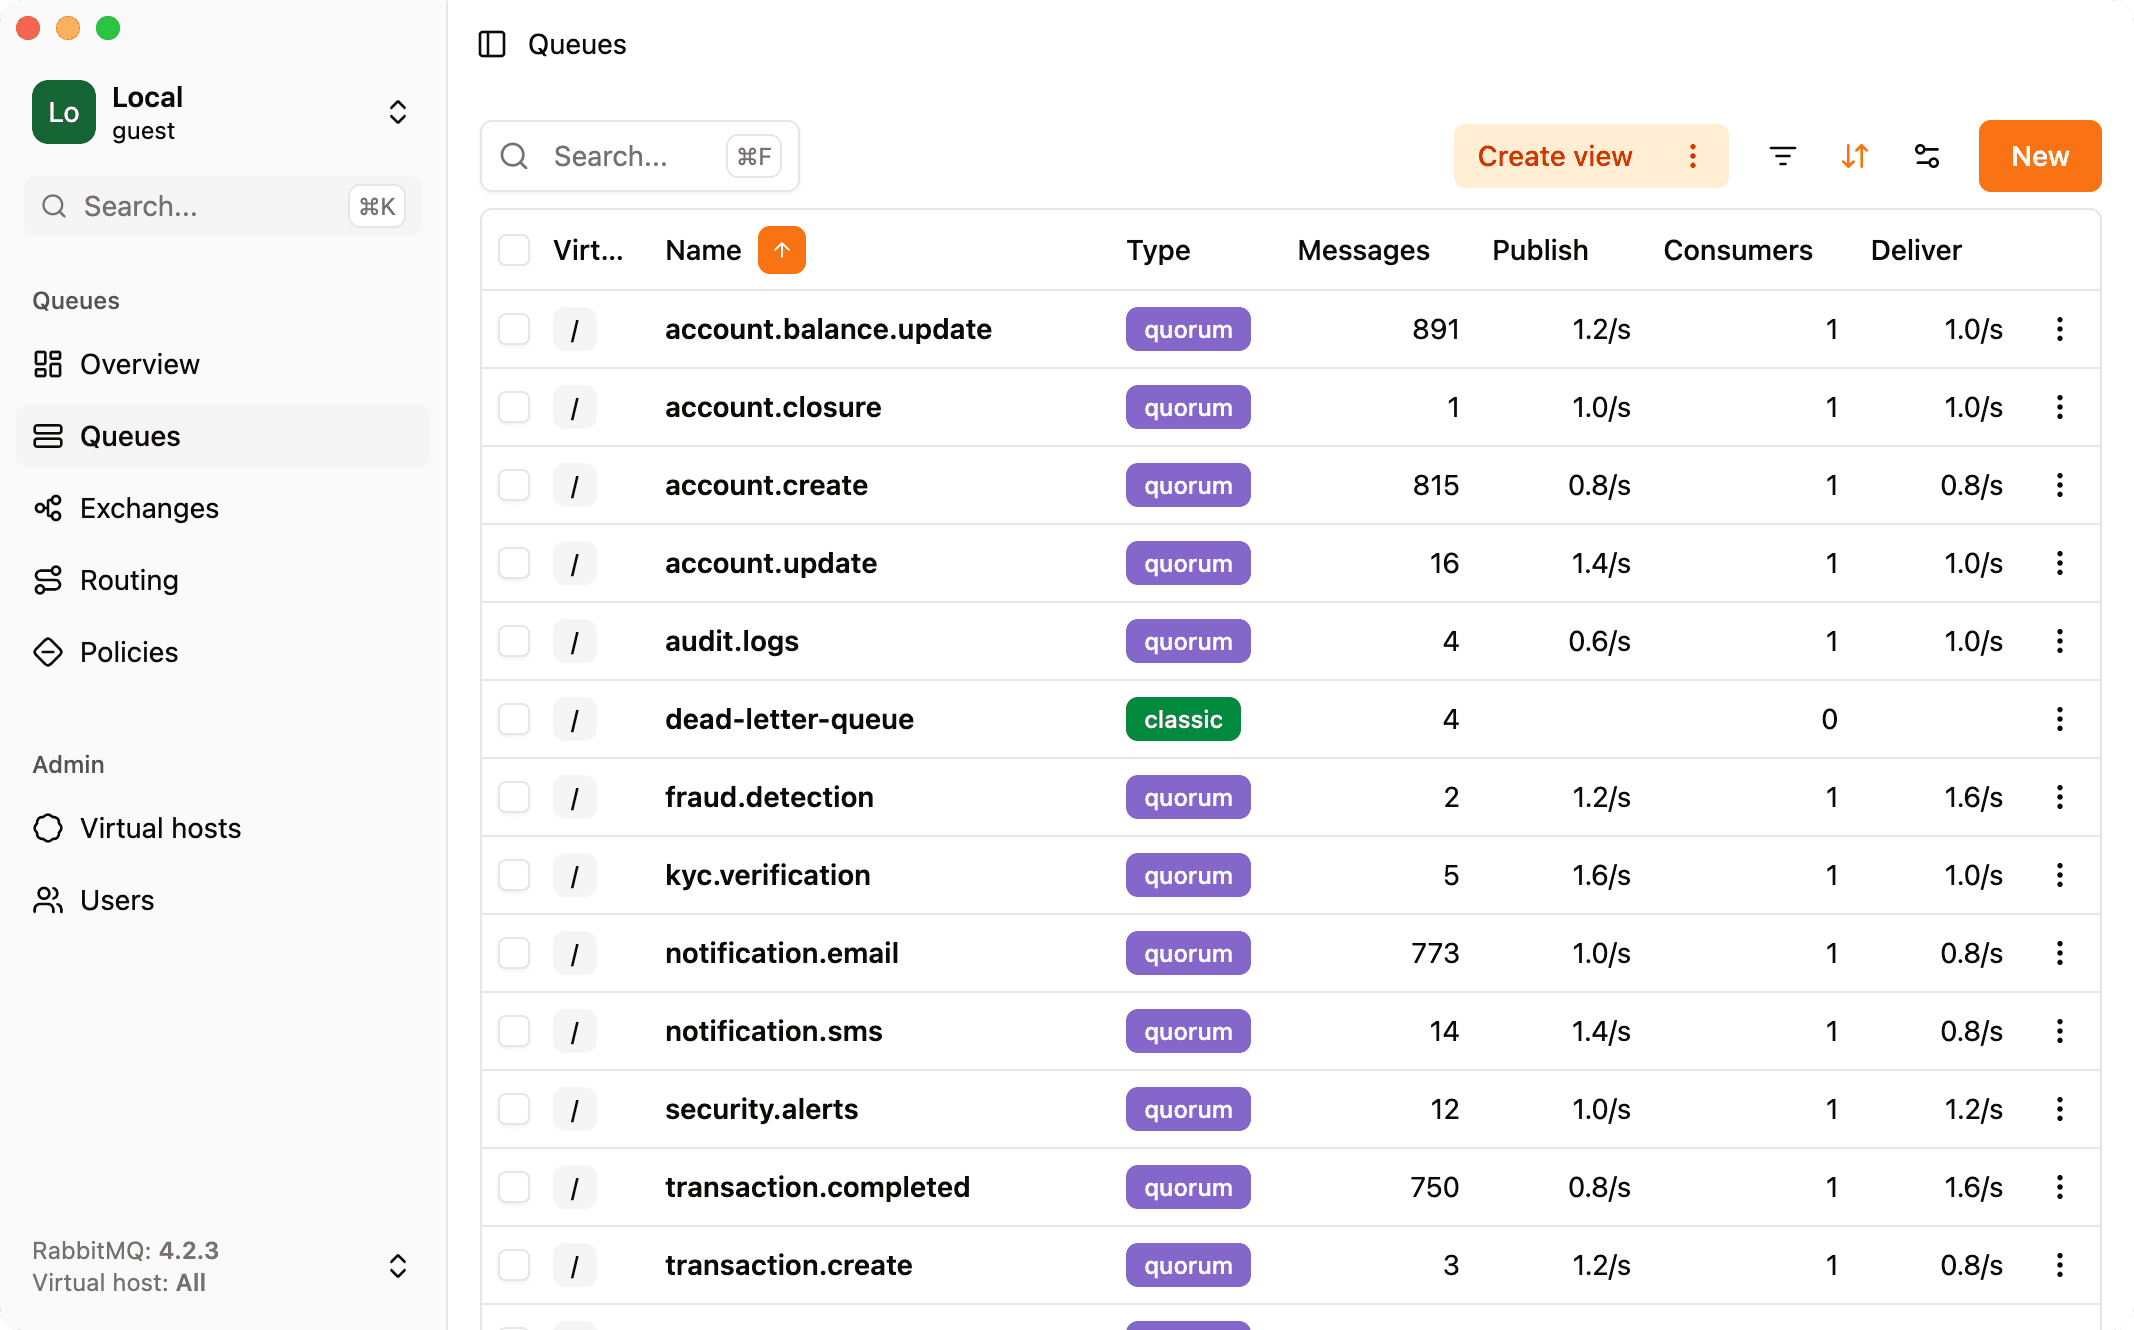
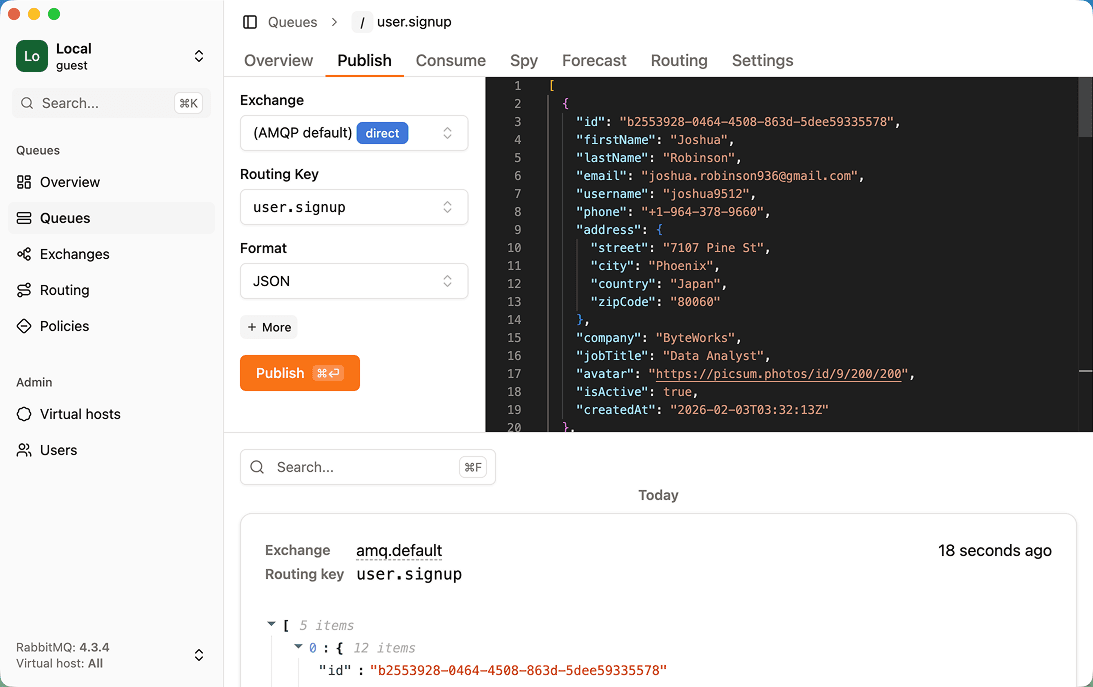
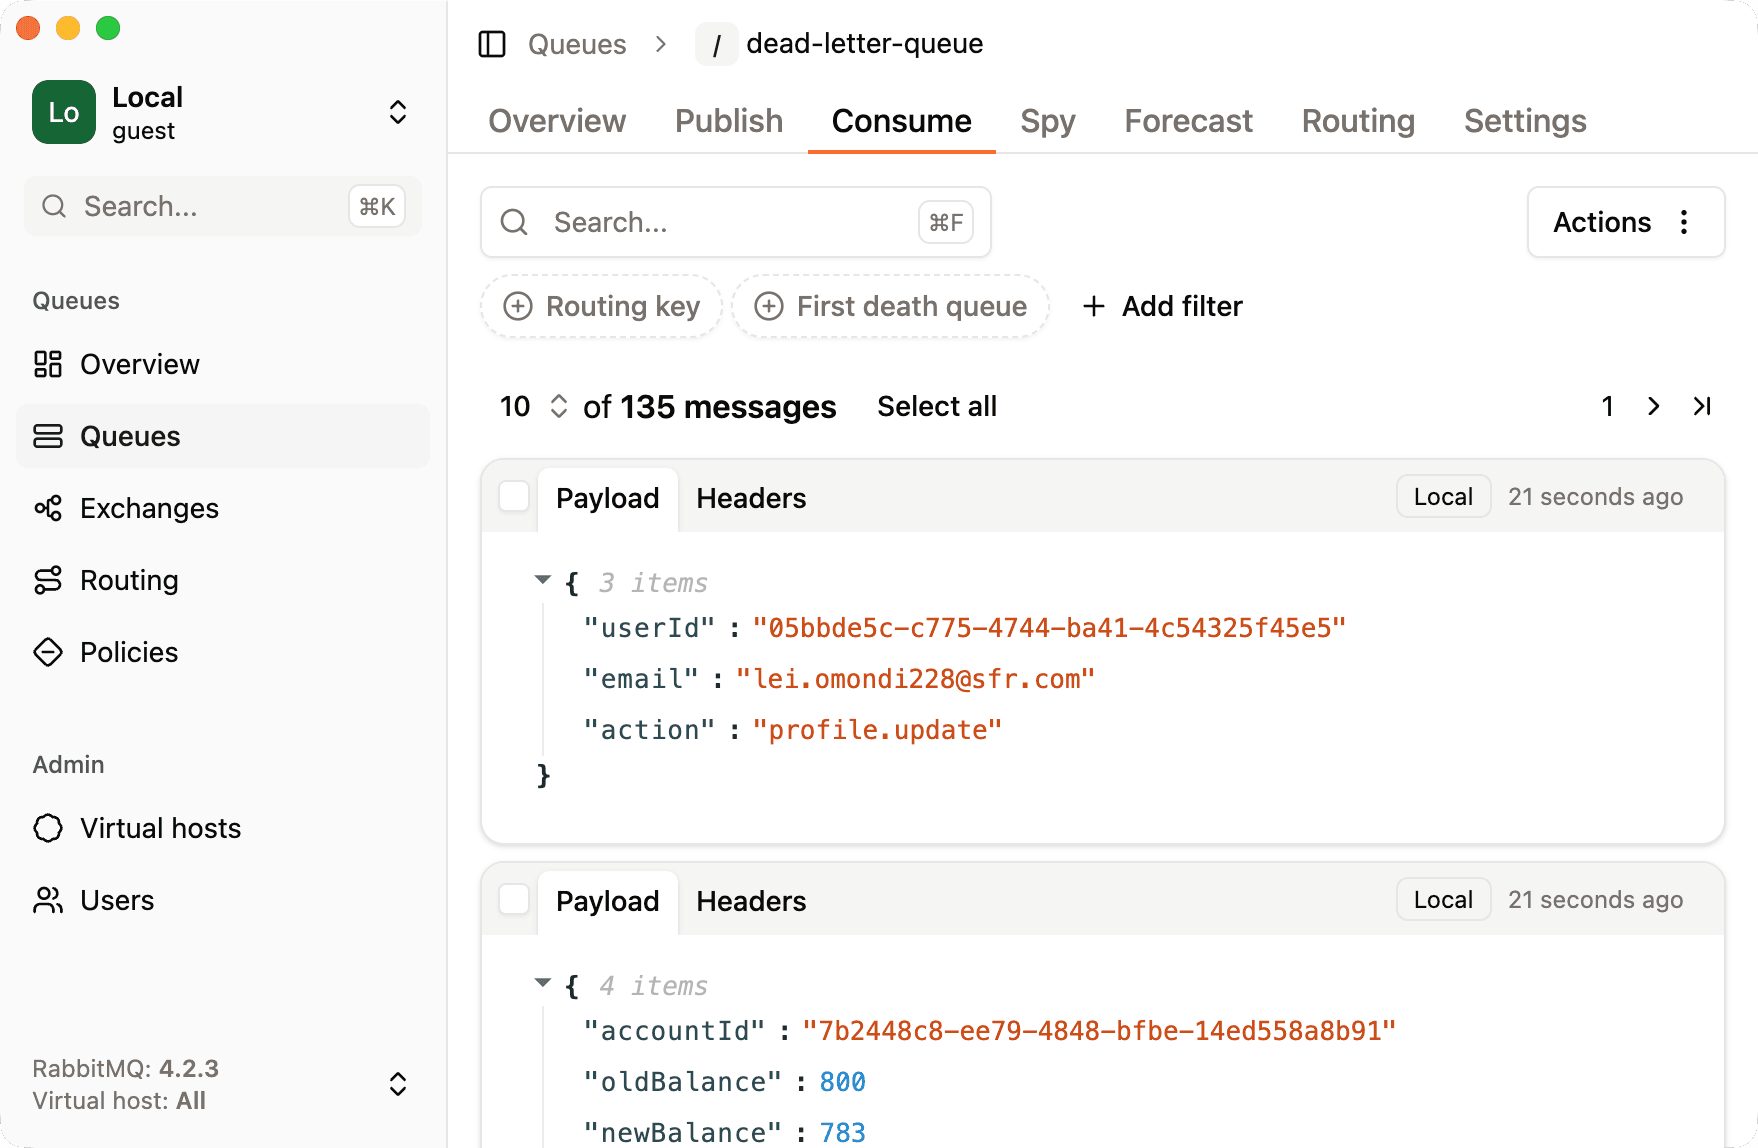
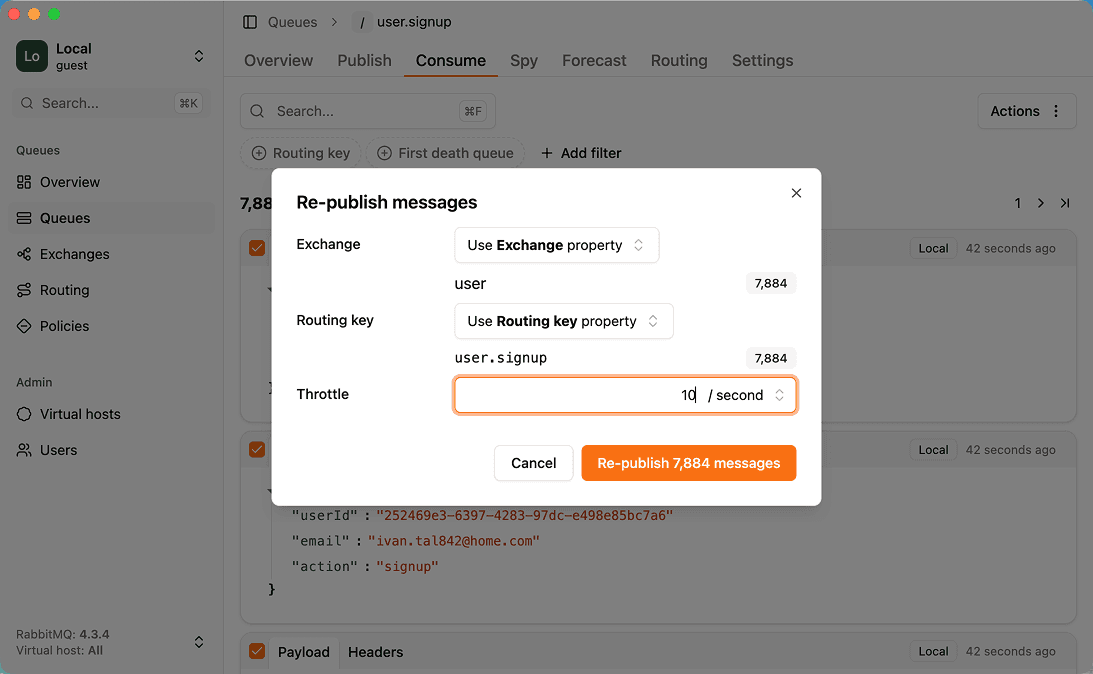
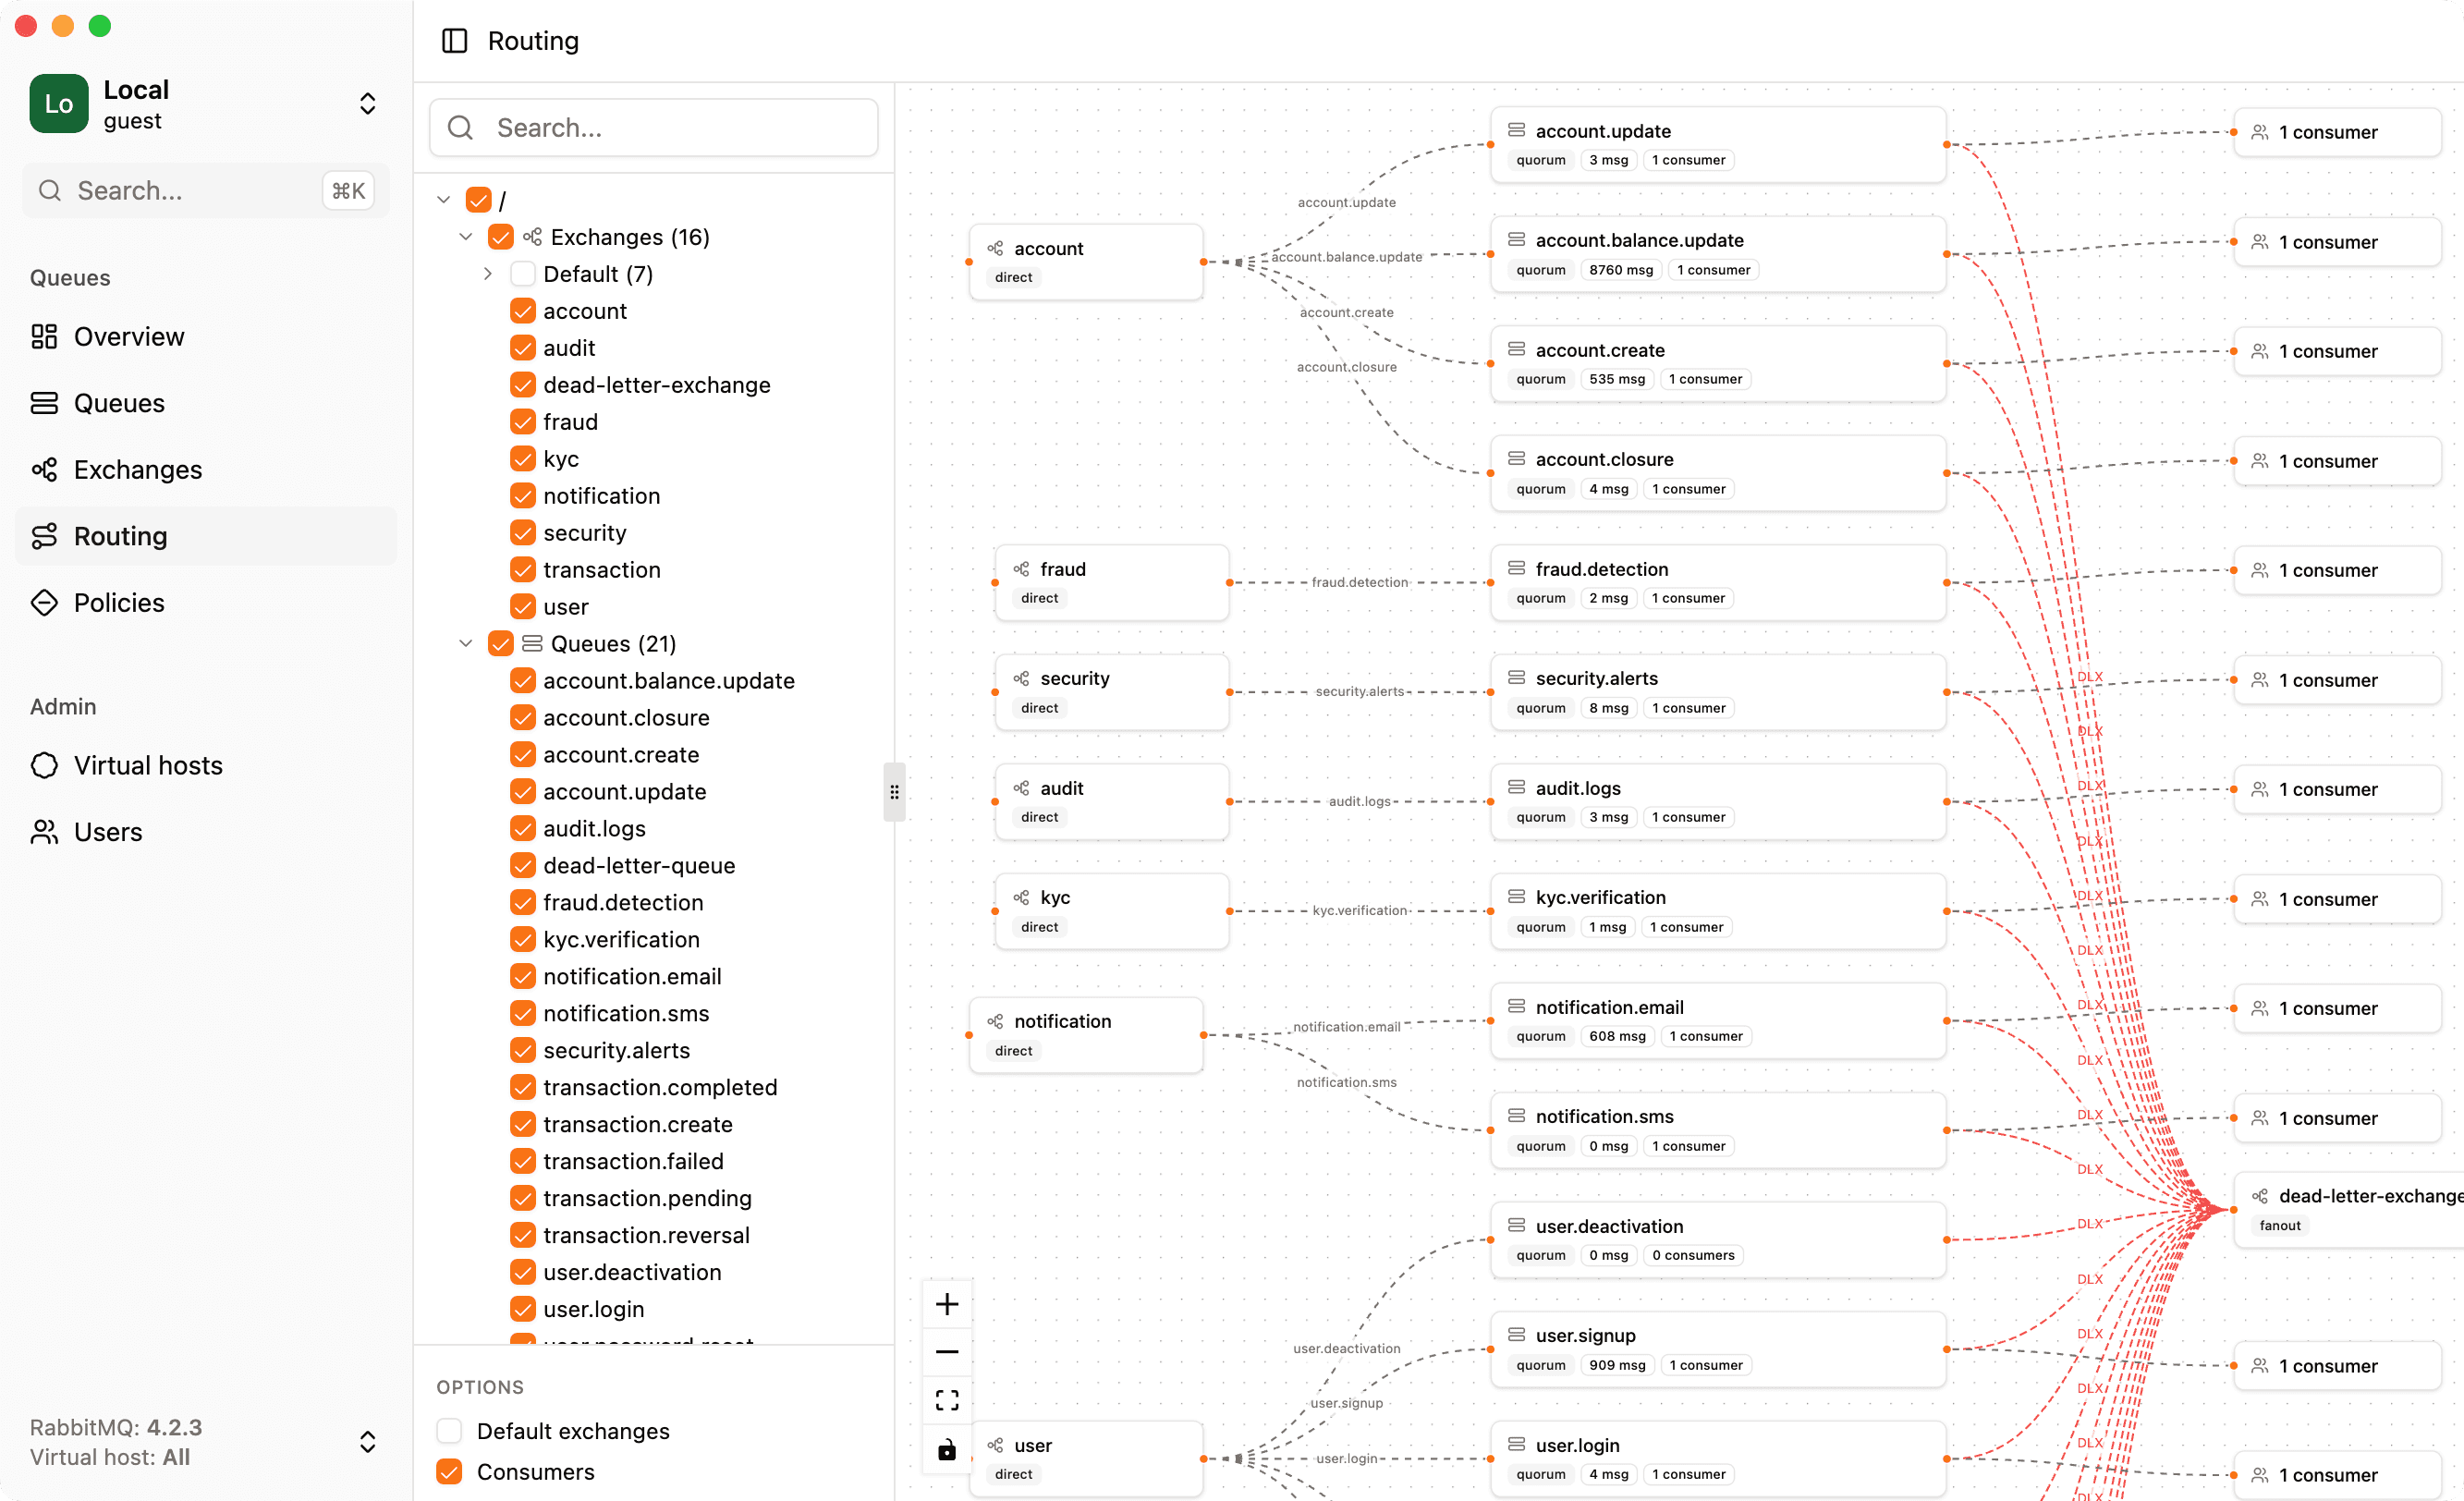
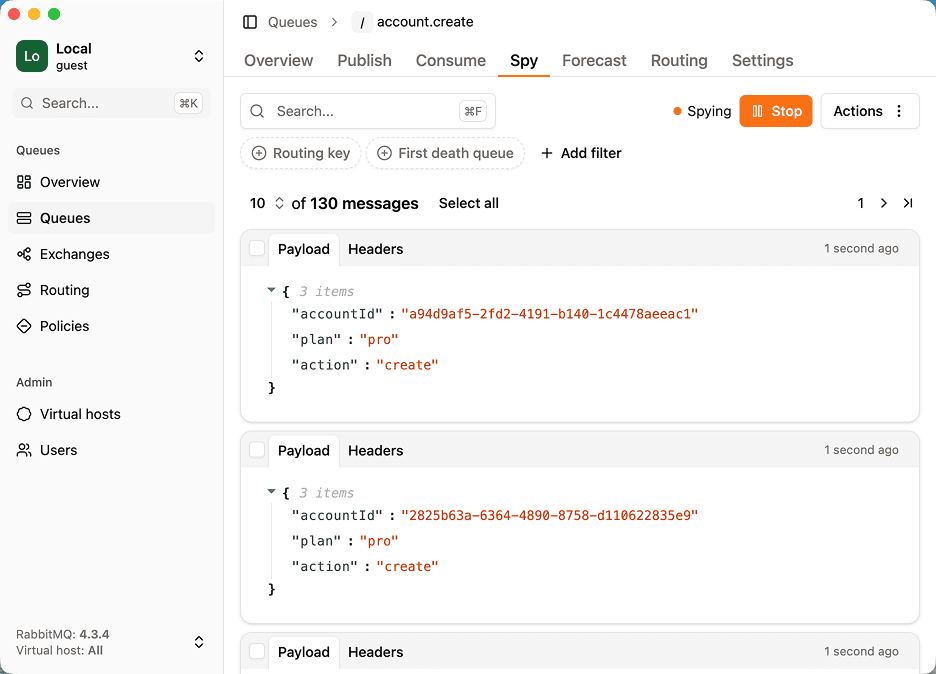
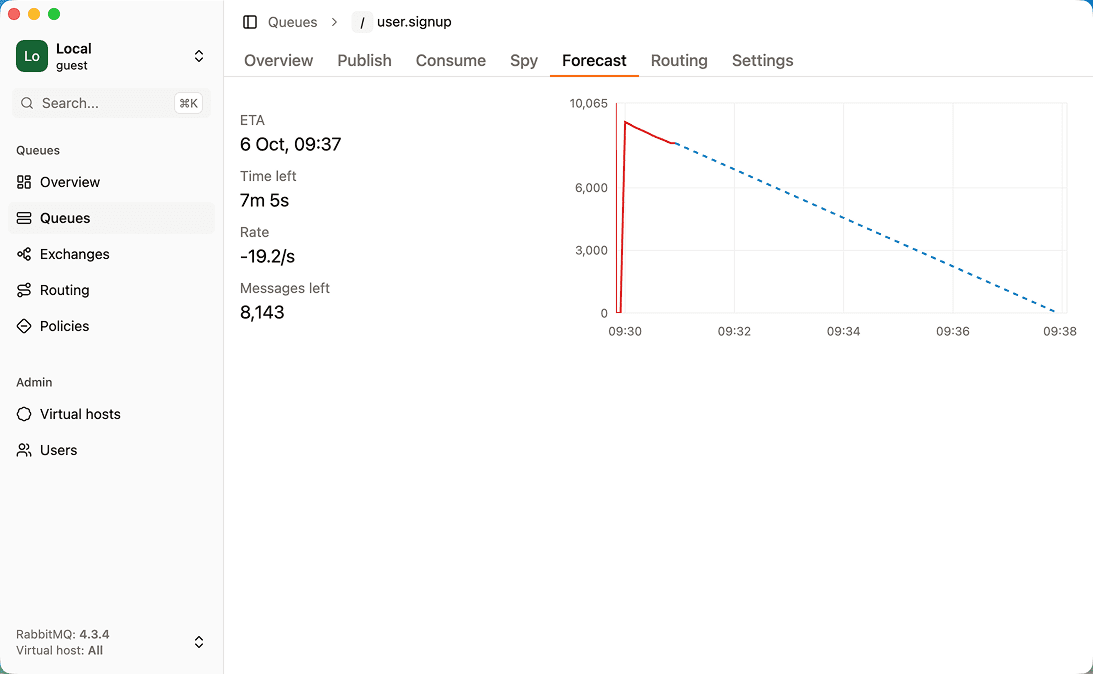
RabbitGUI is a desktop app for macOS, Windows and Linux that connects to your brokers through the management API. It focuses on day-to-day debugging: browsing and filtering messages, replaying dead letters, spying on live traffic, and visualizing routing.
Strengths
- Dead-letter workflow: inspect, filter and republish failed messages with throttling
- Non-destructive live spy on any queue
- Routing graph, drain-time forecast and policy debugger are unique among RabbitMQ tools
- Native app on macOS, Windows and Linux with nothing to deploy
- Low one-time price with free updates forever and a 30-day refund
Limitations
- Paid (no free tier or trial, a 30-day money-back guarantee instead)
- RabbitMQ only
- Needs the management plugin enabled, like most RabbitMQ tools
- Not a team-wide always-on dashboard: it runs on each developer machine
Best for: Developers who debug RabbitMQ queues, messages and dead letters regularly and want a fast desktop tool. See RabbitGUI in action.
2. RabbitMQ Management UI
Web UI · Any browser · Free (bundled with RabbitMQ)
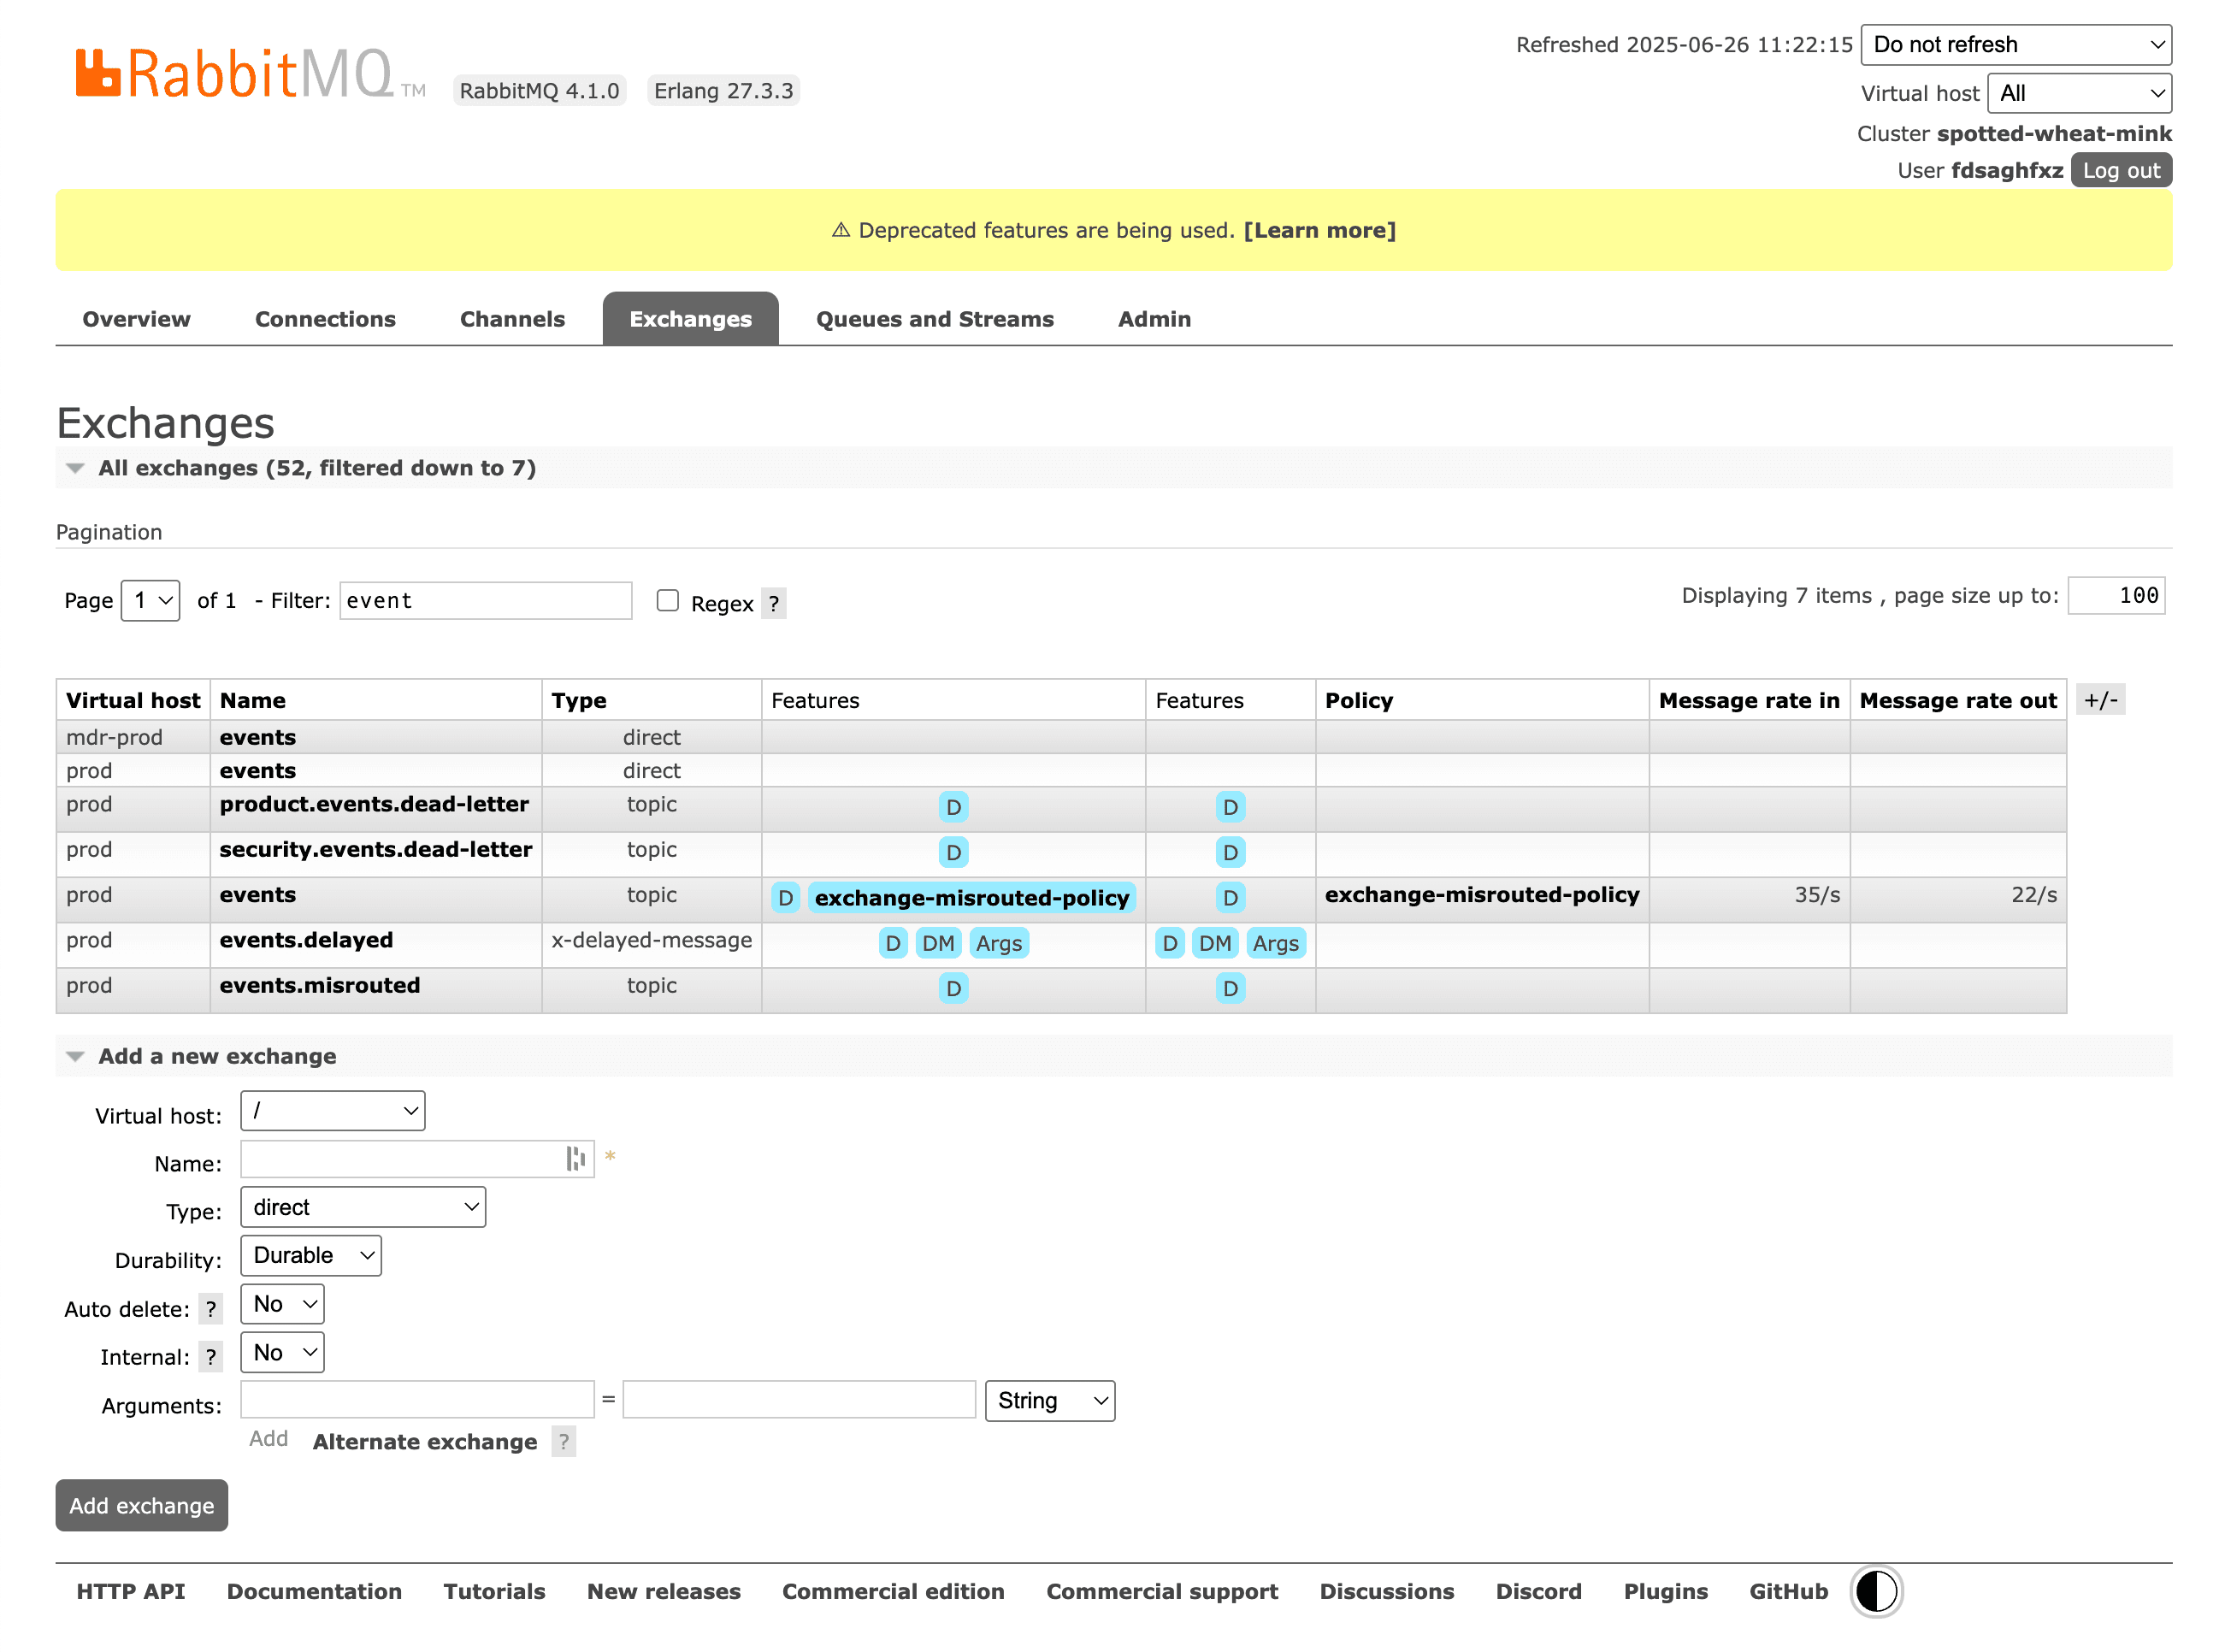
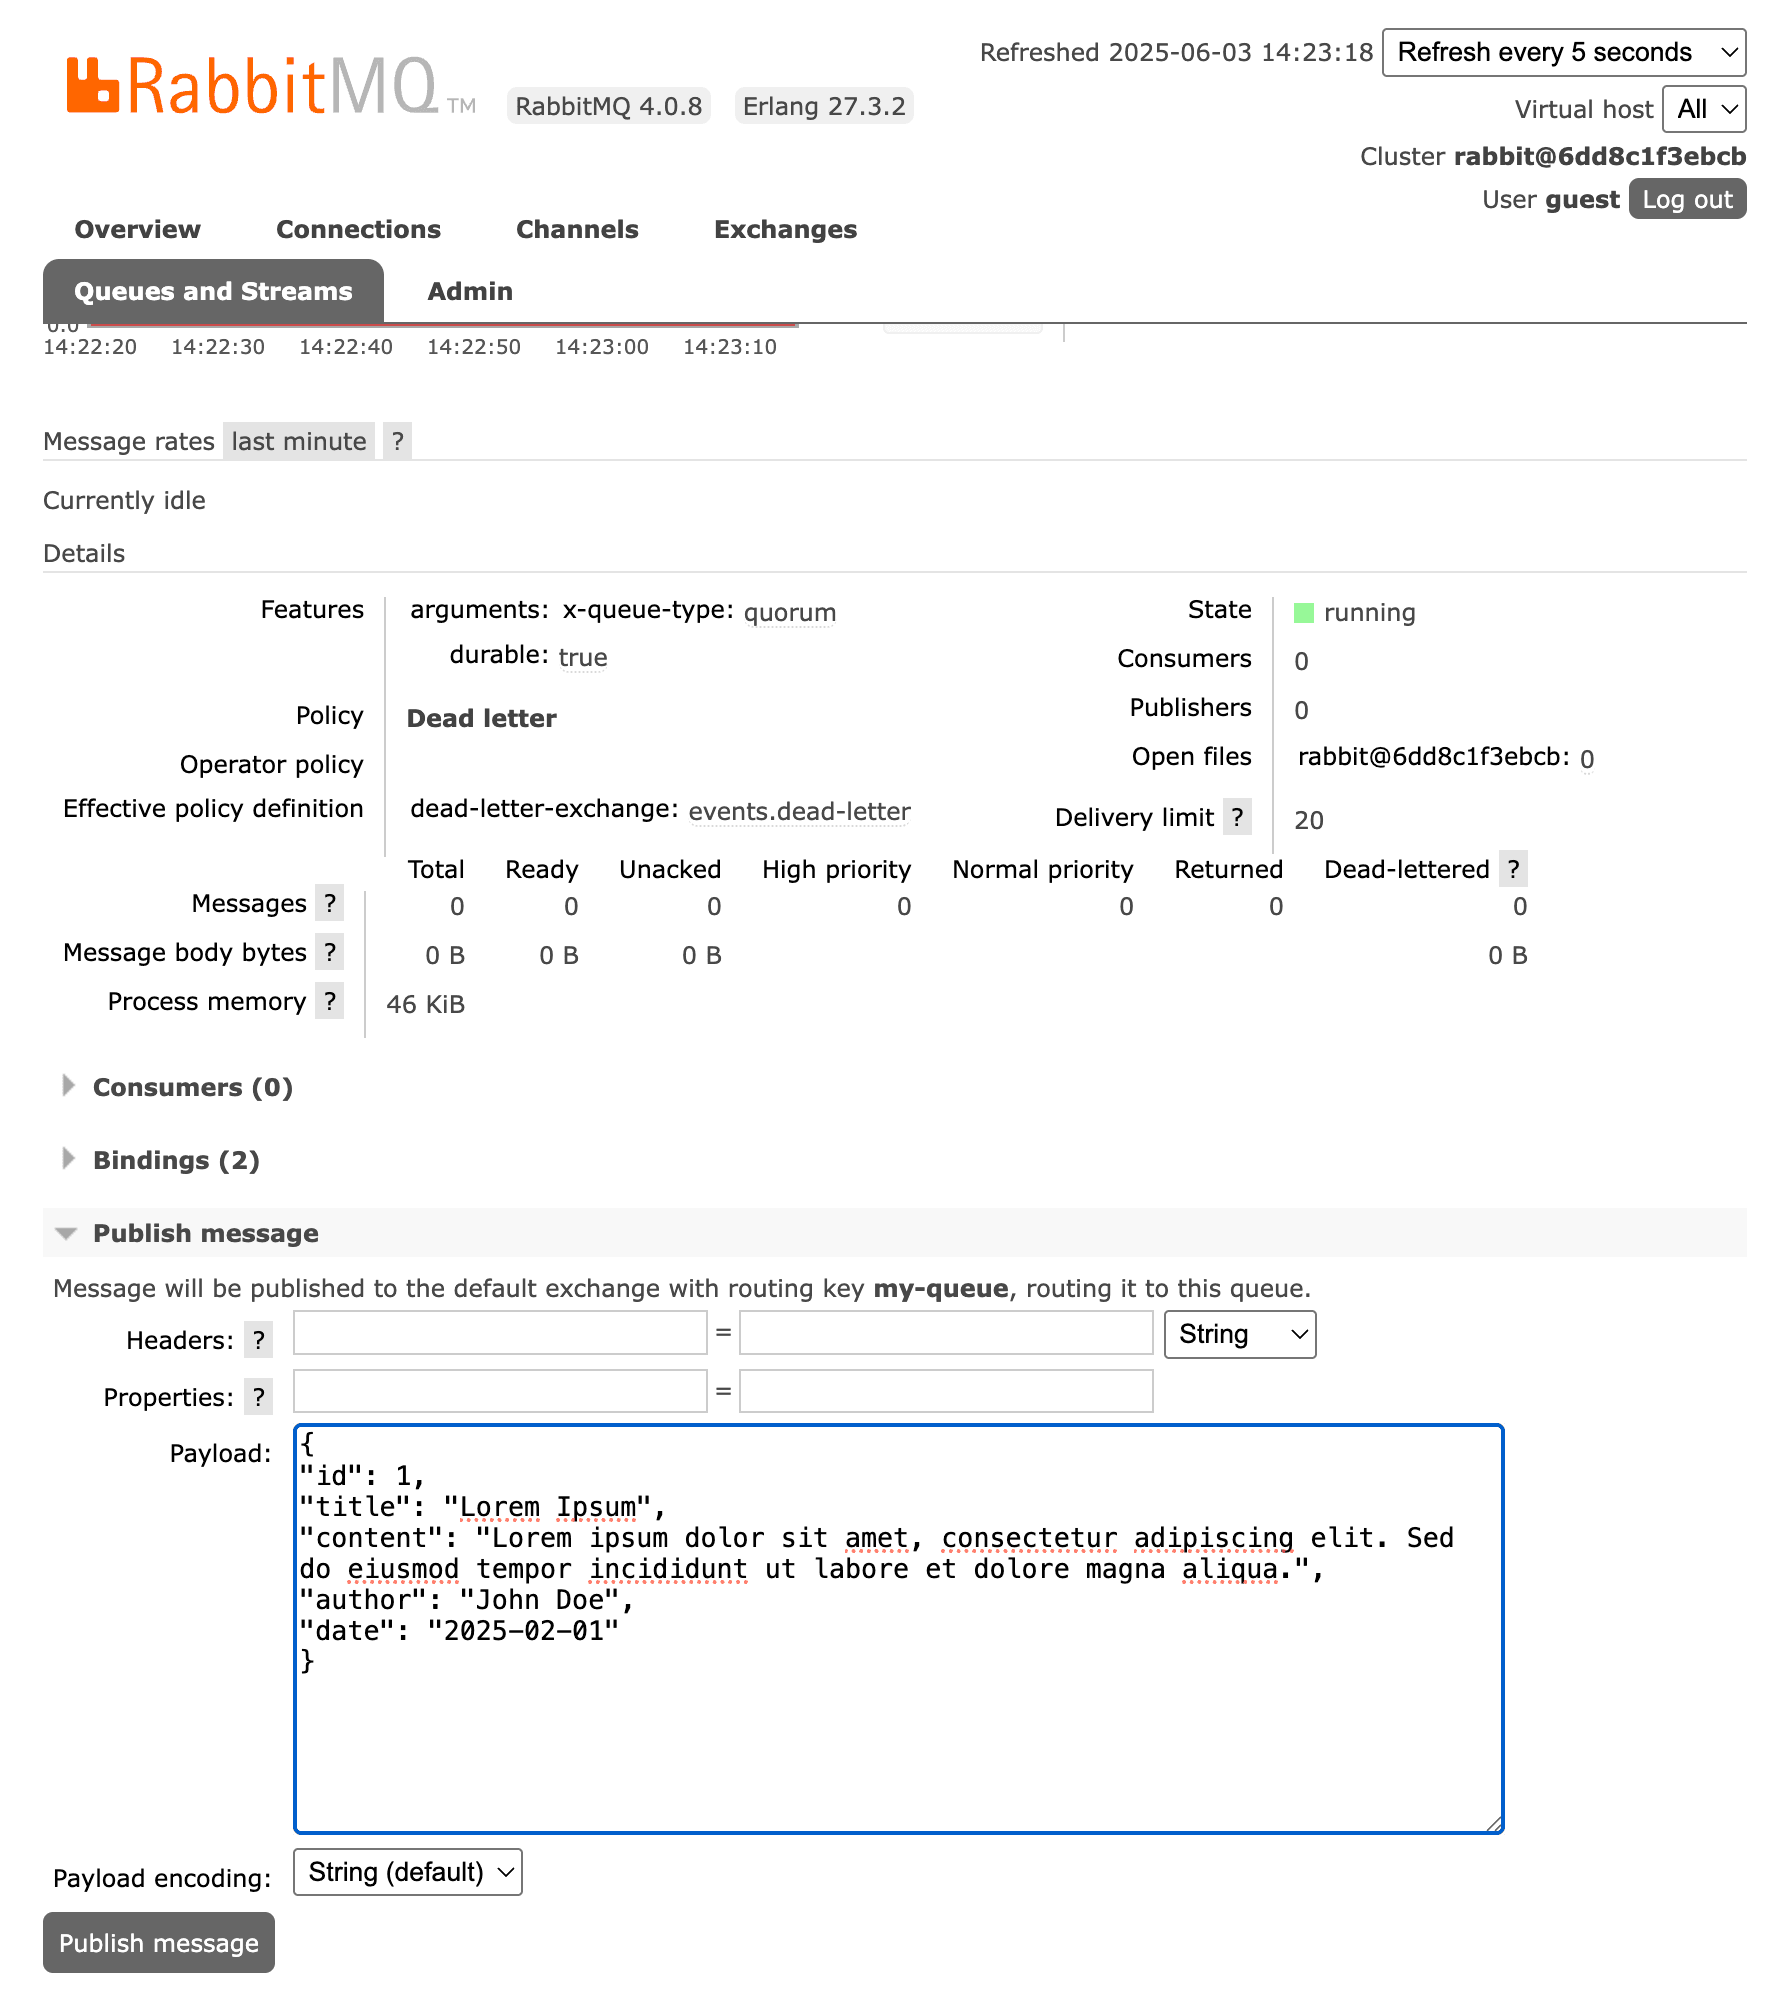
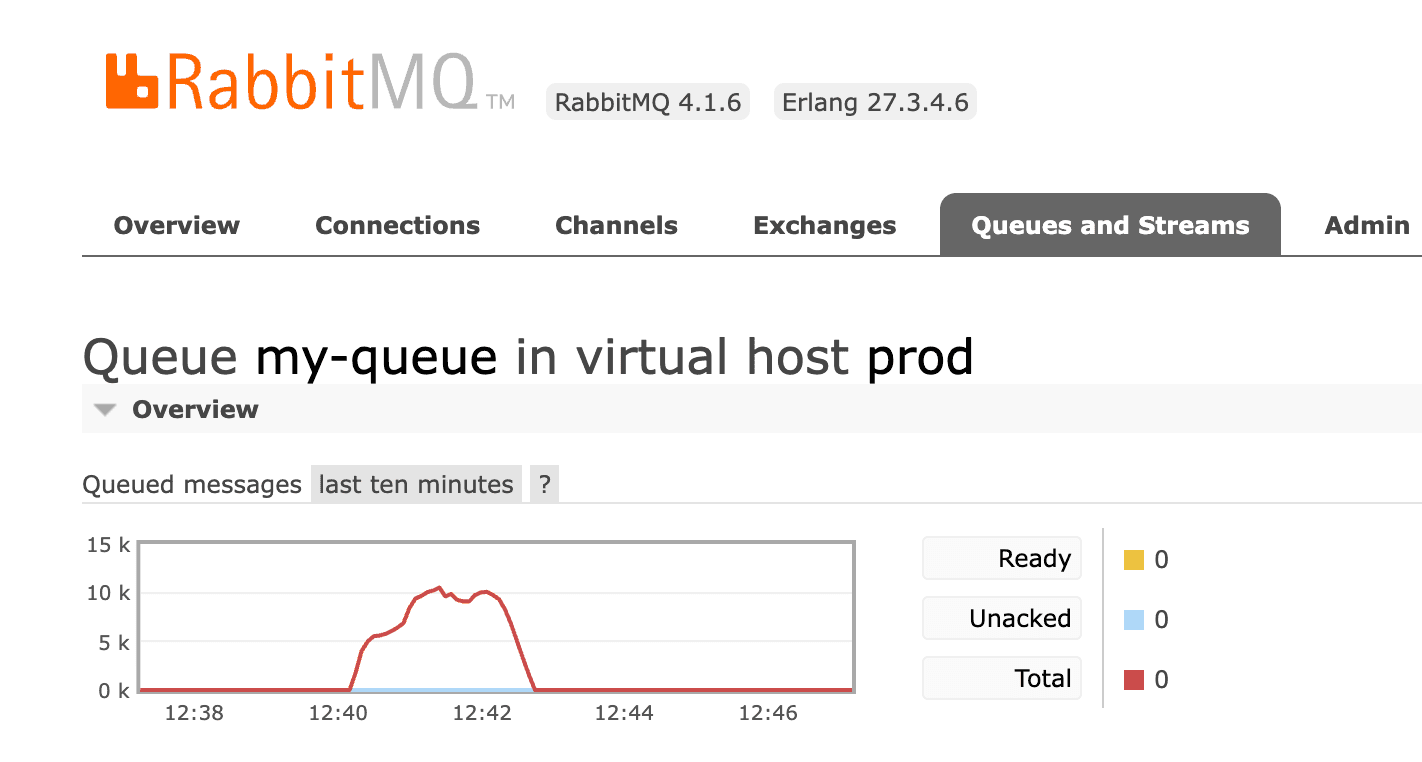
The Management UI ships with RabbitMQ as the rabbitmq_management plugin and is served on port 15672. It covers broker administration well: users, vhosts, permissions, policies, queues, exchanges, connections and basic charts.
Strengths
- Free and already installed with most RabbitMQ setups
- Complete administration: users, vhosts, permissions, policies, feature flags
- Officially maintained by the RabbitMQ team
- Works from any browser, nothing to install on your machine
Limitations
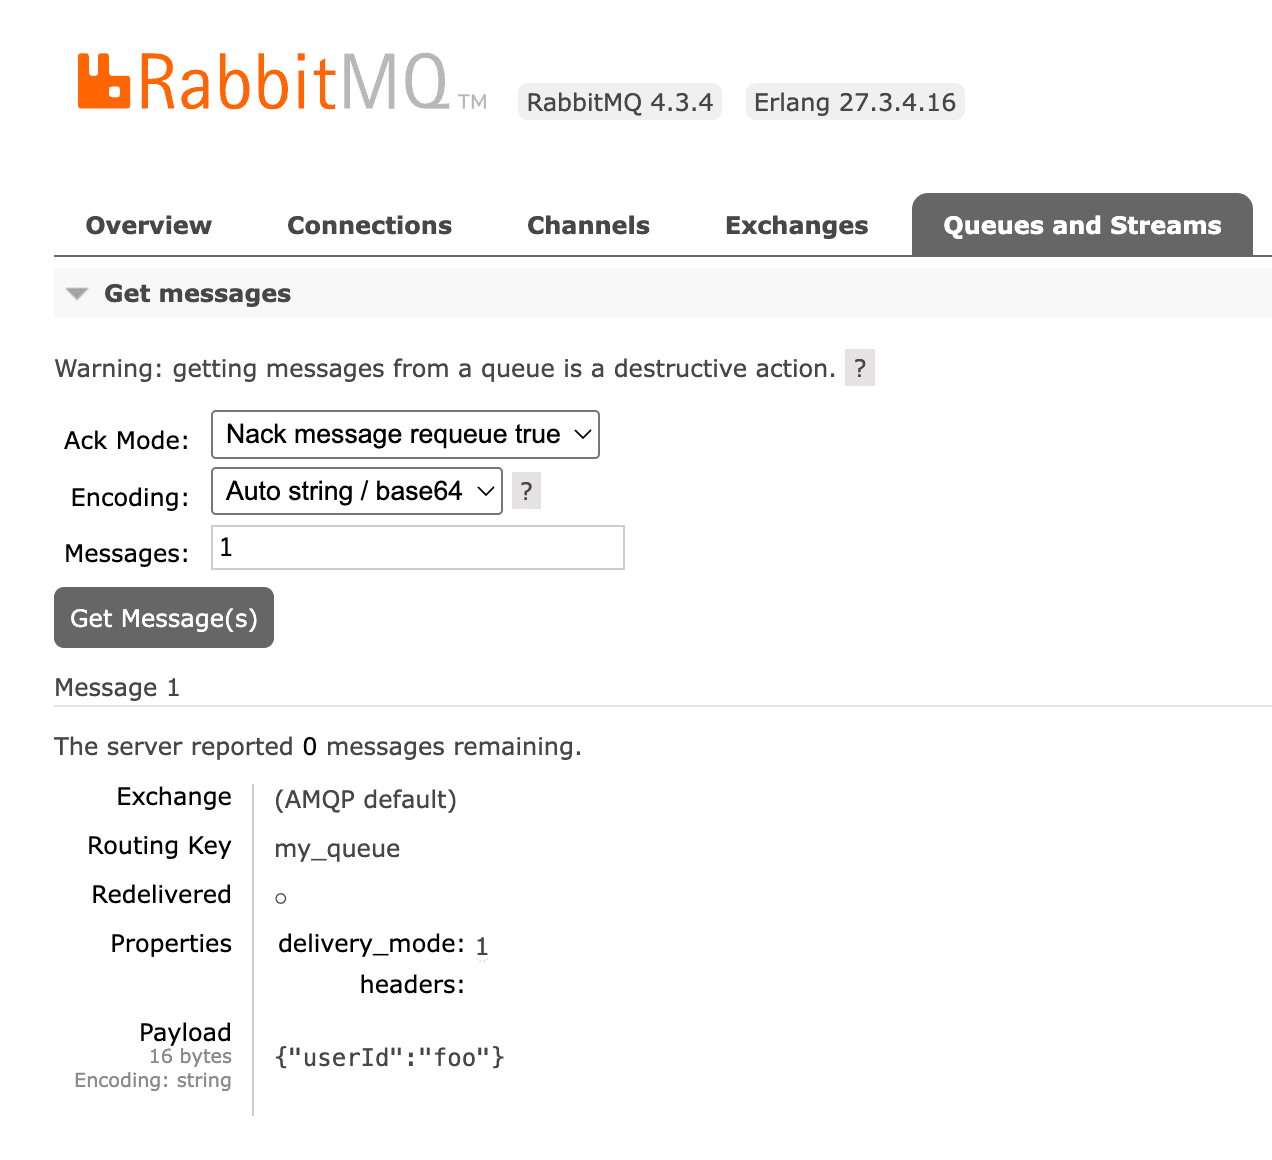
- No safe way to browse a queue: "Get messages" is a consume plus requeue
- No message search, filtering or selective replay
- One broker at a time, credentials re-entered per environment
- Slow and cluttered with thousands of queues
Best for: Broker administration (users, permissions, policies) and quick checks when nothing else is installed. See RabbitMQ Management UI alternatives.
3. QueueExplorer
Desktop app · Windows, macOS, Linux · $149 per computer (Standard) or $249 (Professional)
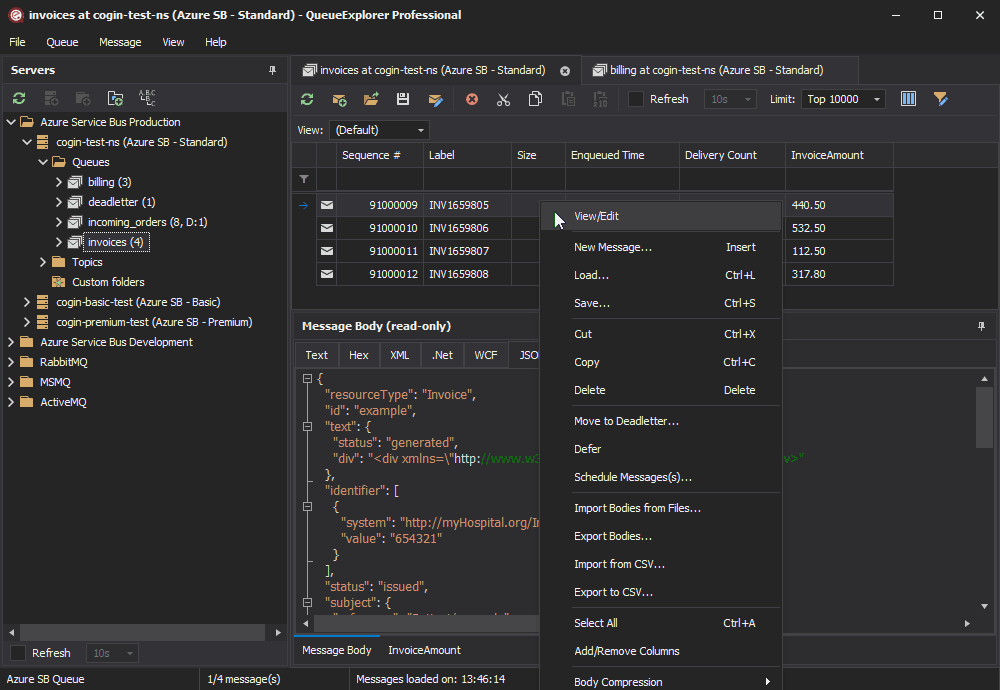
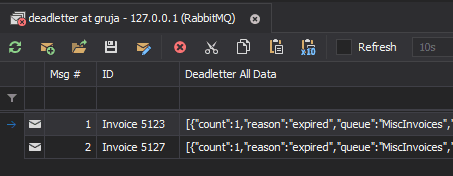
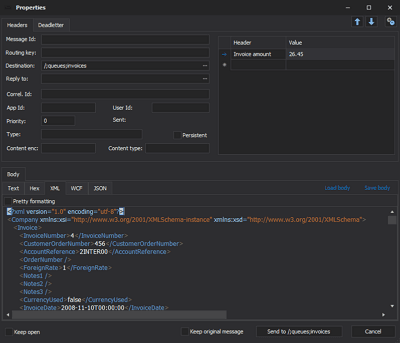
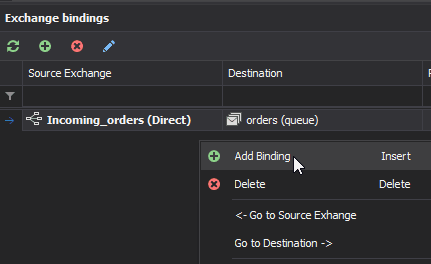
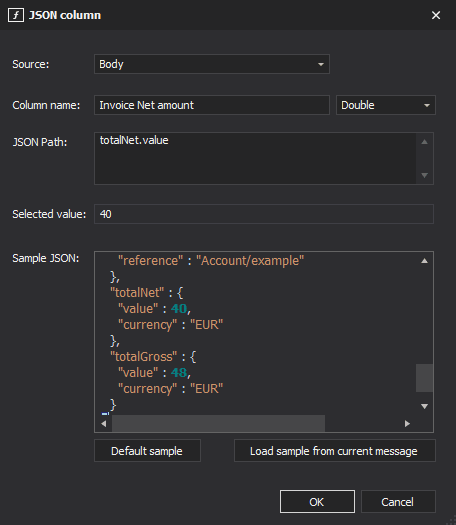
QueueExplorer by Cogin is a long-standing desktop tool for message-level work on several brokers. For RabbitMQ it loads queue messages progressively, browses streams by offset, filters on bodies and headers, and lets you edit, copy, move, save and replay messages.
Strengths
- Supports several brokers in one tool (RabbitMQ, Azure Service Bus, MSMQ, ActiveMQ)
- Mature message editing: edit, copy, move, save to files and reload
- Browses RabbitMQ streams by offset
- Free trial on every platform
Limitations
- Priced per computer: $149 (Standard) or $249 (Professional)
- Licence includes 12 months of updates, extra years are paid
- Advanced filtering (JSON/XPath/regex columns) requires Professional
- Focused on messages: no routing graph or drain forecast documented
Best for: Teams working with several message brokers, or who need heavy message editing and stream browsing. See QueueExplorer alternatives.
4. RabbitScout
Self-hosted web dashboard · Self-hosted (Node.js or Docker), any browser · Free
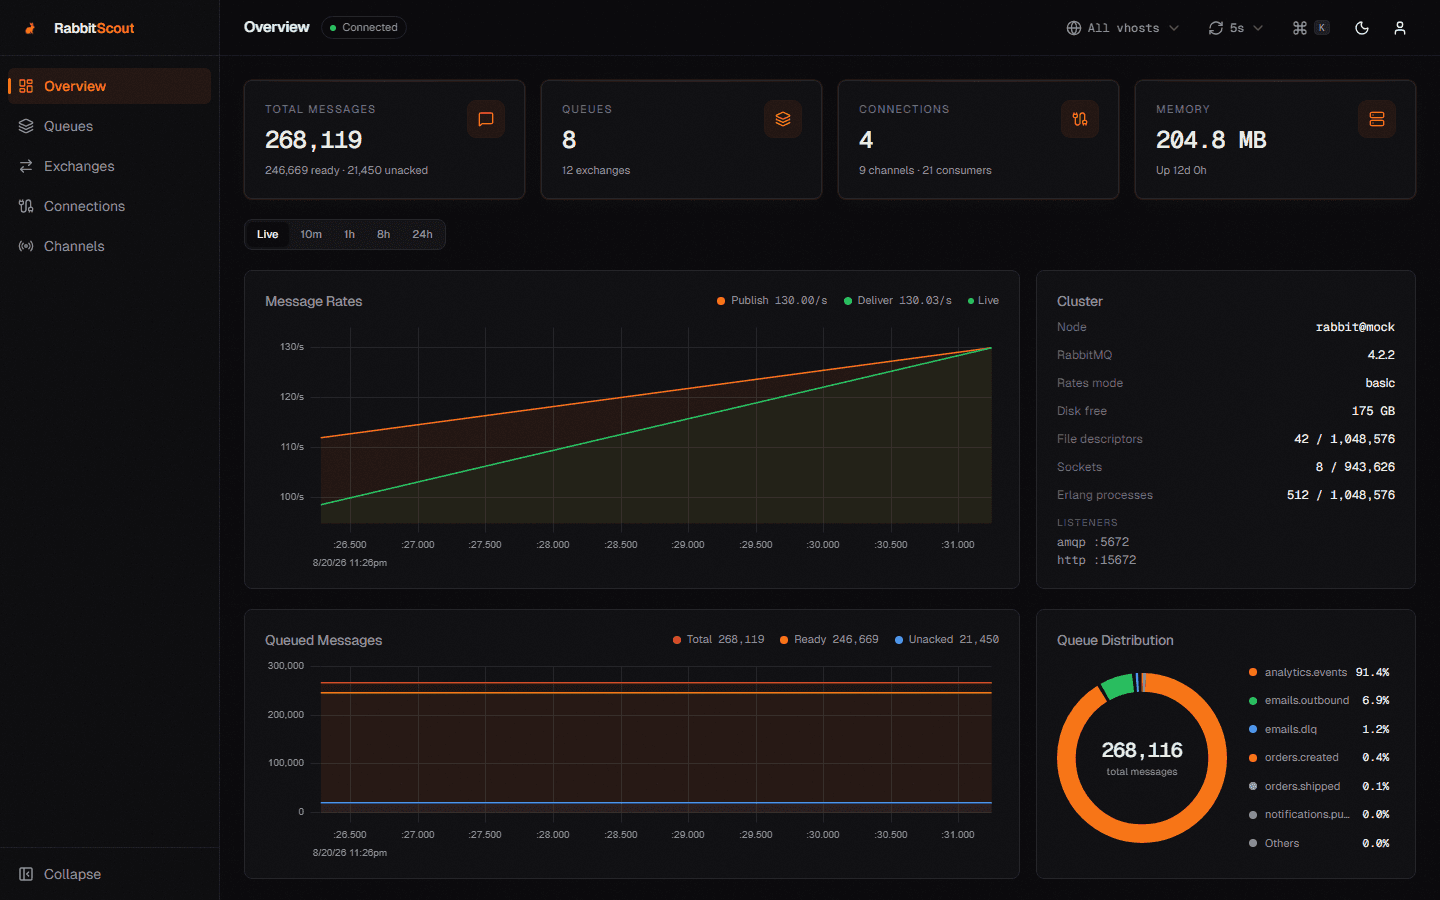
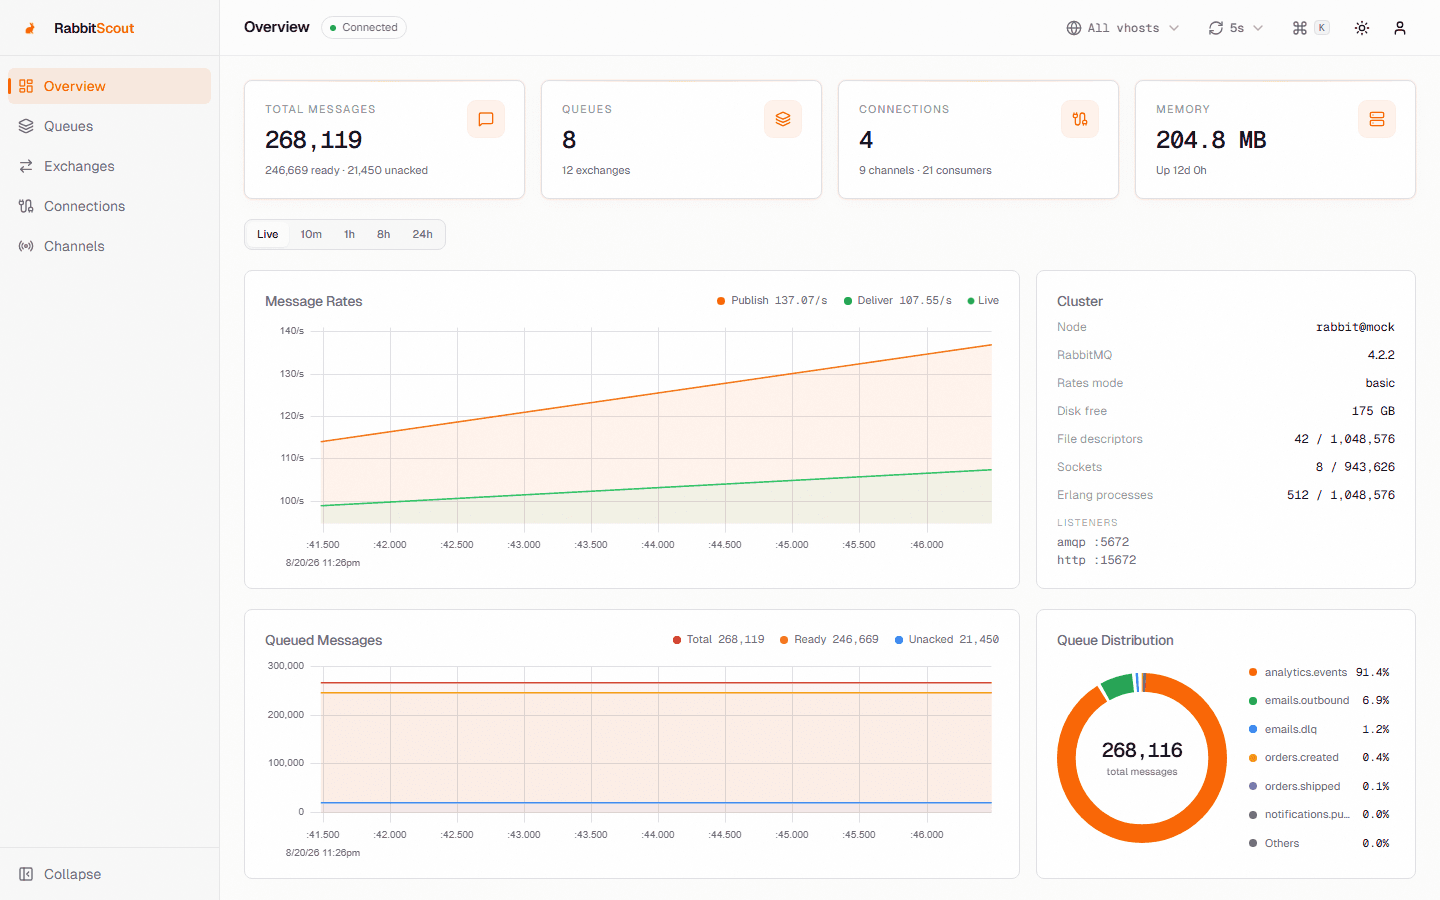
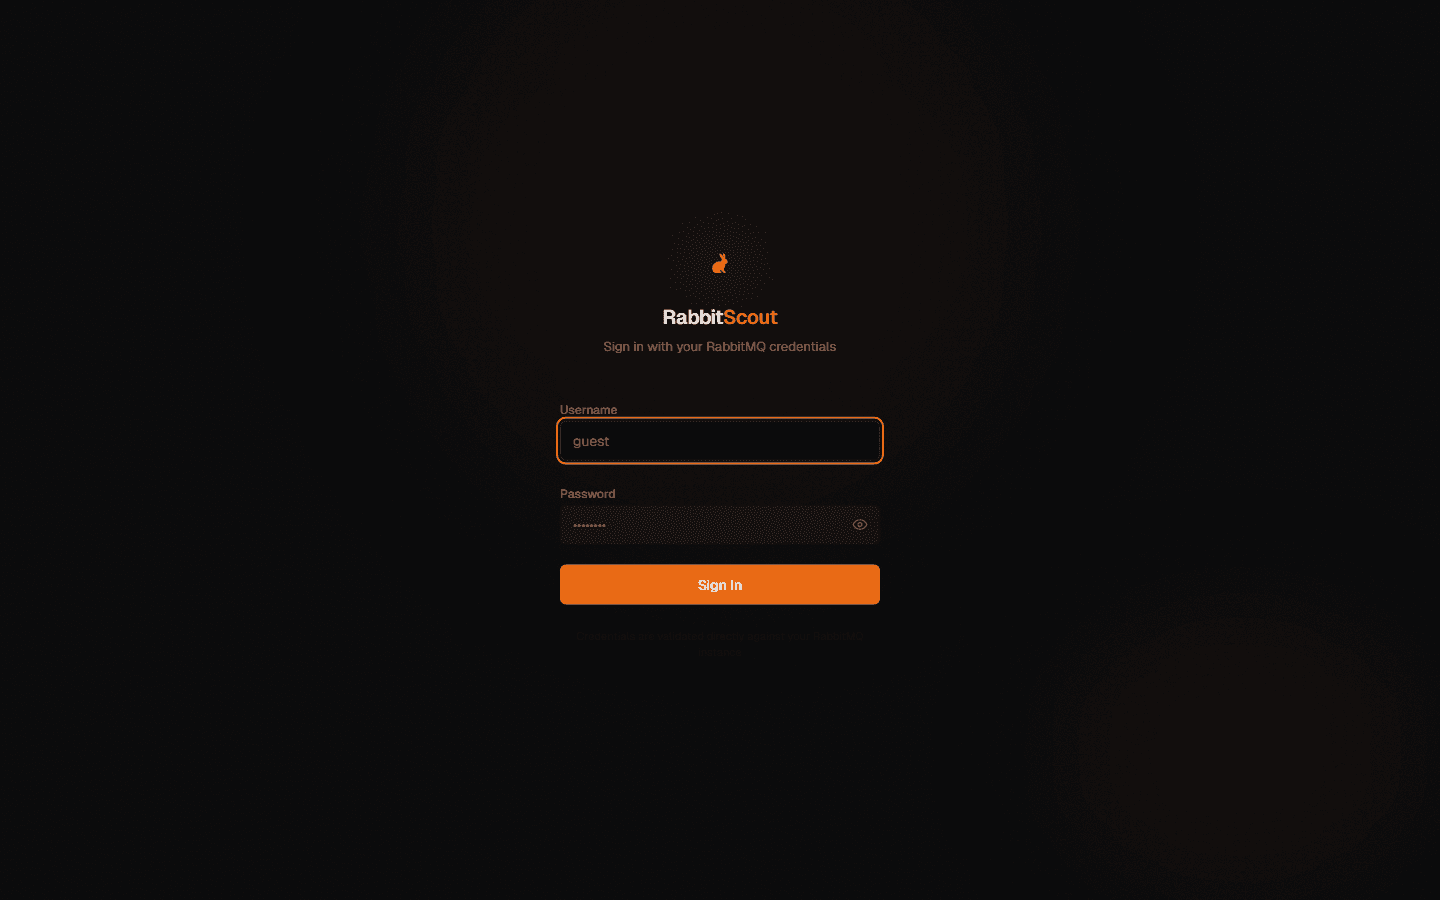
RabbitScout is an MIT-licensed Next.js dashboard that proxies the RabbitMQ management API. You deploy it (Node.js or Docker) next to a broker and each user logs in with their own RabbitMQ credentials. It offers live charts, queue and exchange management, message peeking and test publishing.
Strengths
- Free and open source (MIT)
- Modern, fast web UI with live charts and a command palette
- Shared by a whole team from one deployment
- Respects RabbitMQ user tags and permissions
Limitations
- You have to deploy, expose and maintain another web service
- One broker per deployment
- Message tooling is basic: peek and publish, no documented replay workflow
Best for: Teams who want a free, modern, shared web dashboard and are happy to self-host it. See RabbitScout alternatives.
5. RabbitMQ UI (Chrome extension)
Browser extension · Chrome · Free
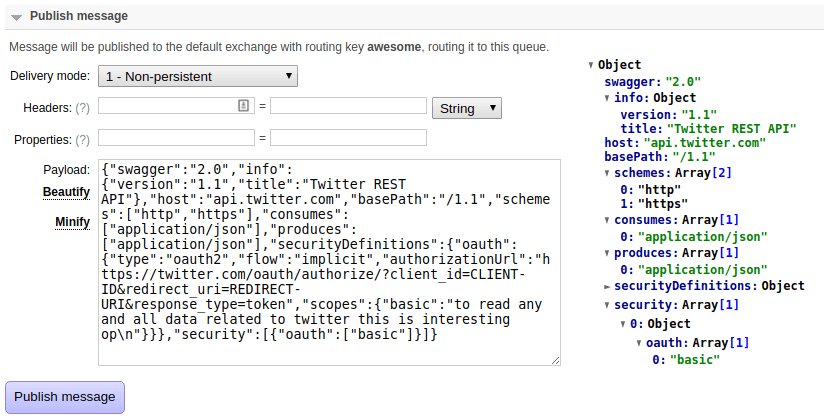
The "RabbitMQ UI" Chrome extension adds conveniences to the management web console: it remembers the last message published to each queue and parses, beautifies and minifies JSON payloads.
Strengths
- Free and installs in seconds
- Makes JSON payloads readable in the Management UI
Limitations
- Only tweaks the Management UI, so it inherits all its limits
- Chrome only
- Rarely updated (last listed update in 2023)
Best for: People who are happy with the Management UI and only want nicer JSON handling. See RabbitMQ UI (Chrome extension) alternatives.
6. rabbitmqadmin
CLI · macOS, Windows, Linux · Free
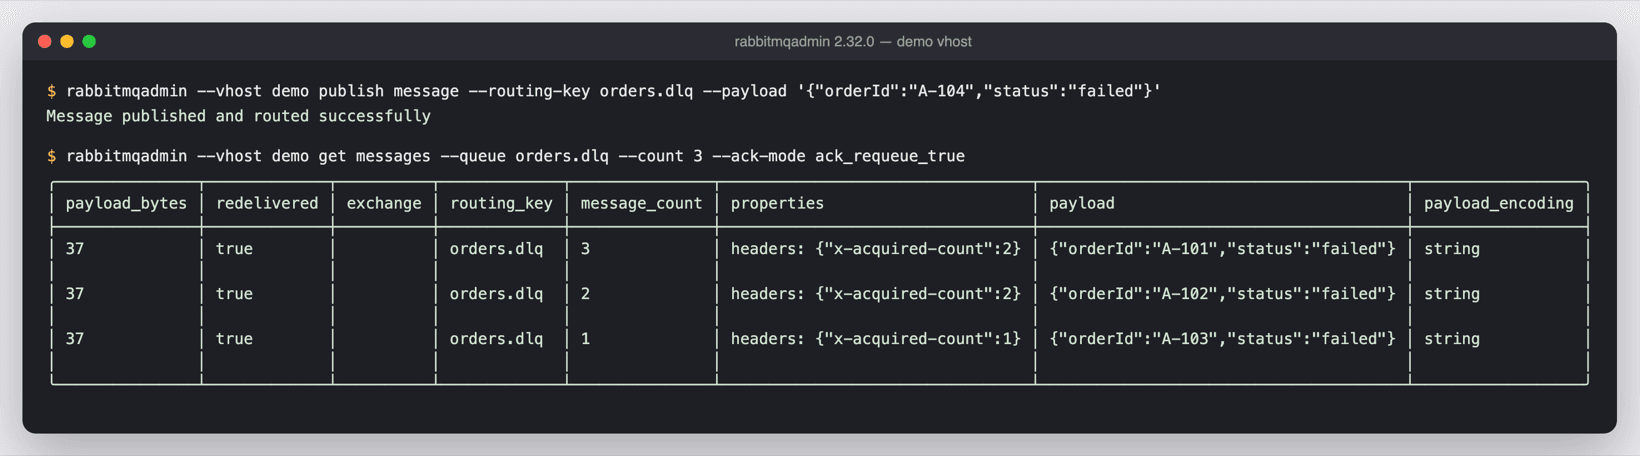
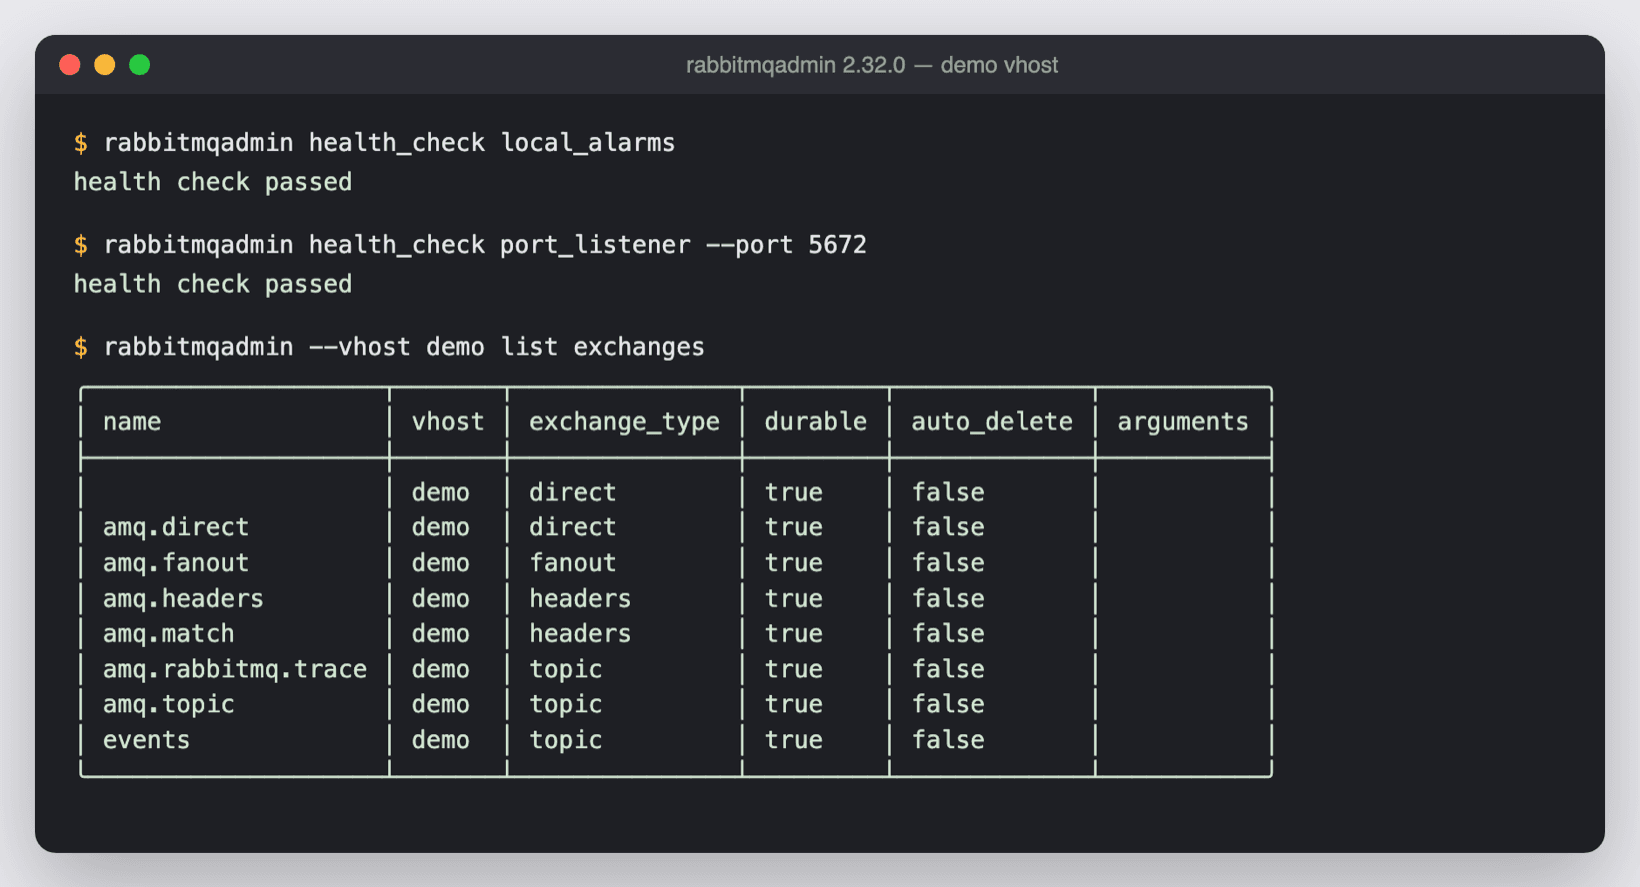
rabbitmqadmin is the official CLI for the RabbitMQ HTTP API. It lists and declares queues, exchanges and bindings, publishes and gets messages, and exports or imports definitions, which makes it ideal for scripts and CI.
Strengths
- Free and official
- Perfect for automation, CI and definitions import/export
- Works over SSH and in containers
Limitations
- Text output: inspecting payloads and routing is tedious
- Same destructive "get" as the Management UI
- No visual overview of routing or queue health
Best for: Scripting, CI pipelines and server-side automation. See rabbitmqadmin alternatives.
7. Grafana + Prometheus
Monitoring stack · Self-hosted or Grafana Cloud, any browser · Free (open source), Grafana Cloud has paid tiers
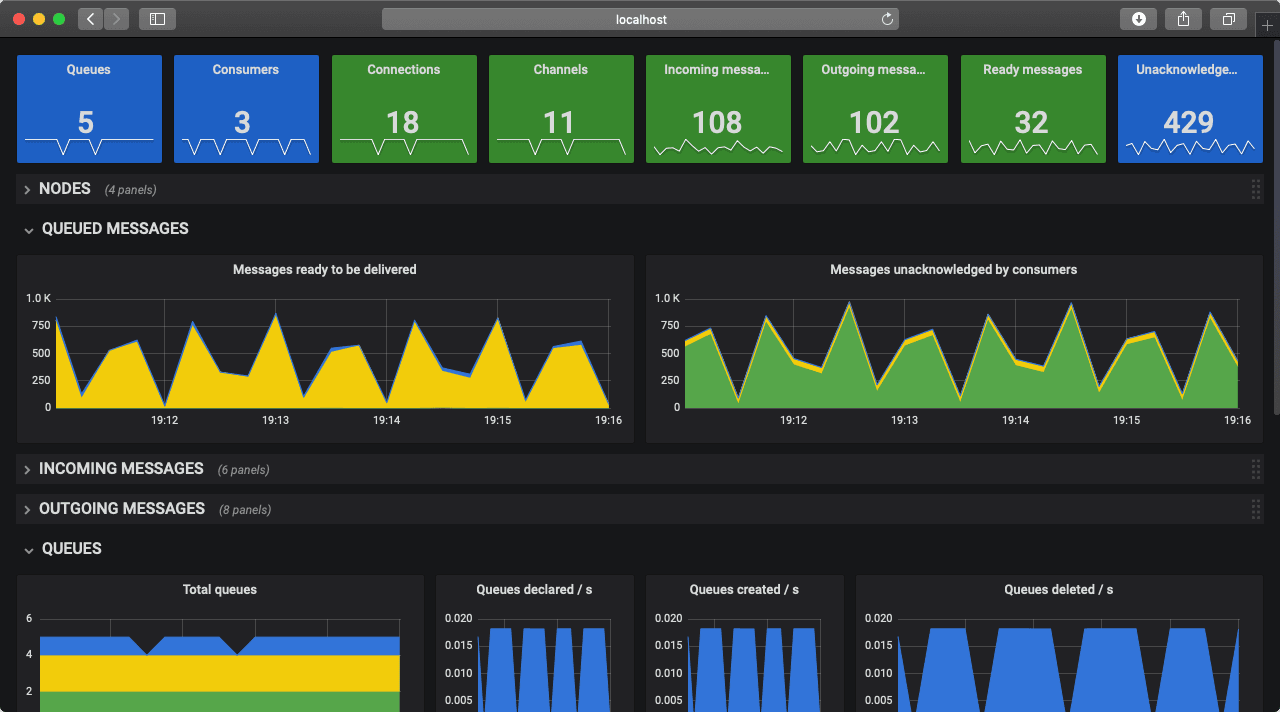
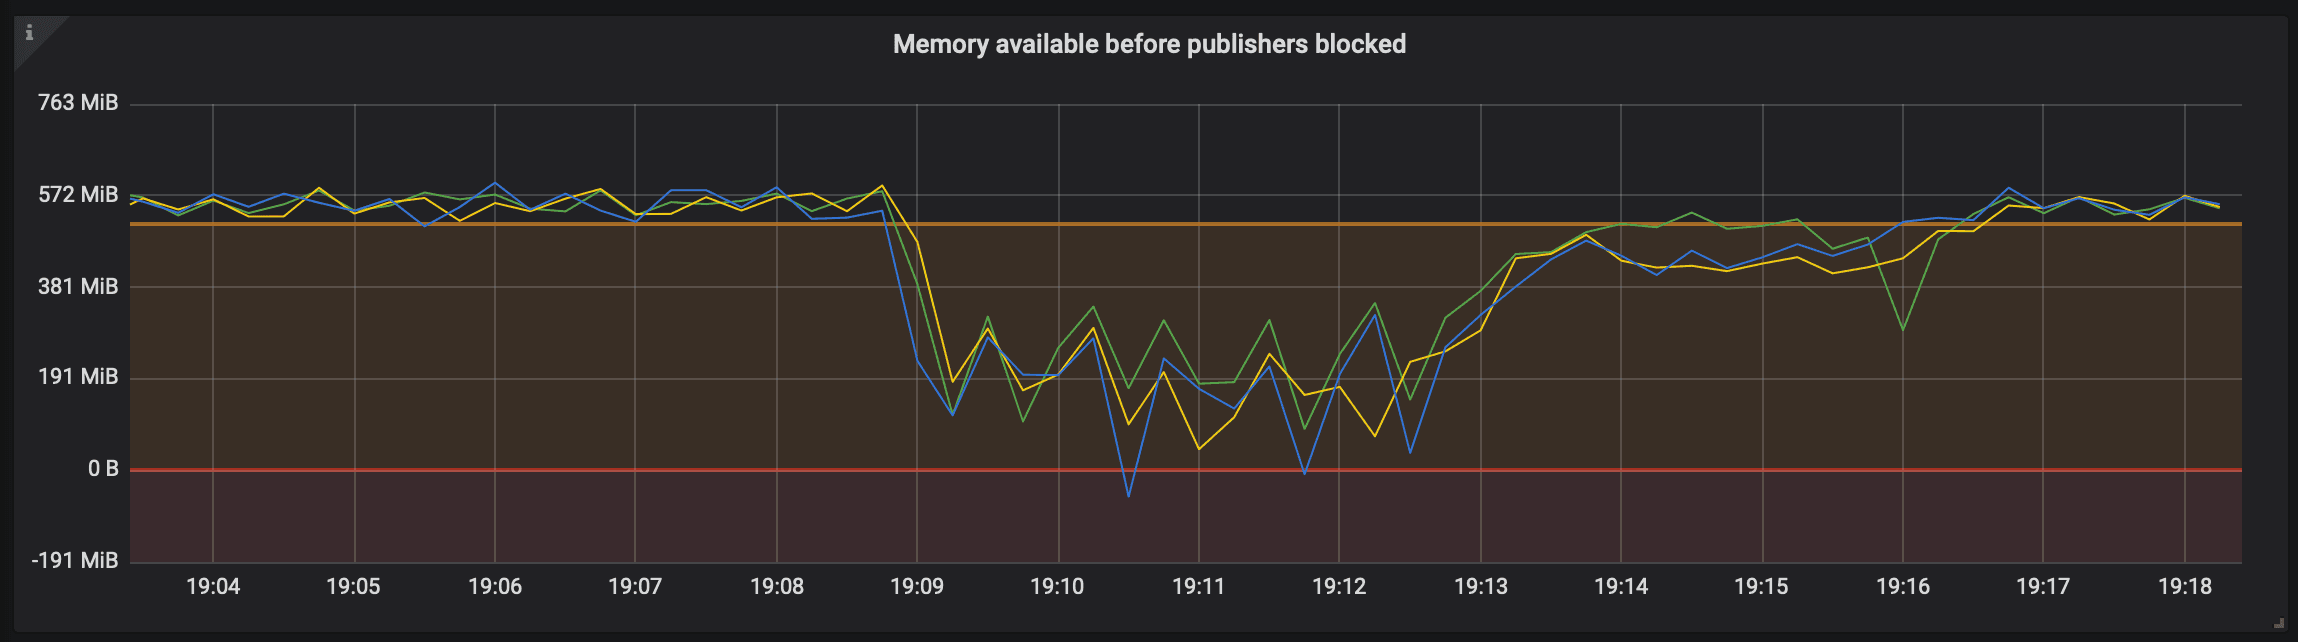
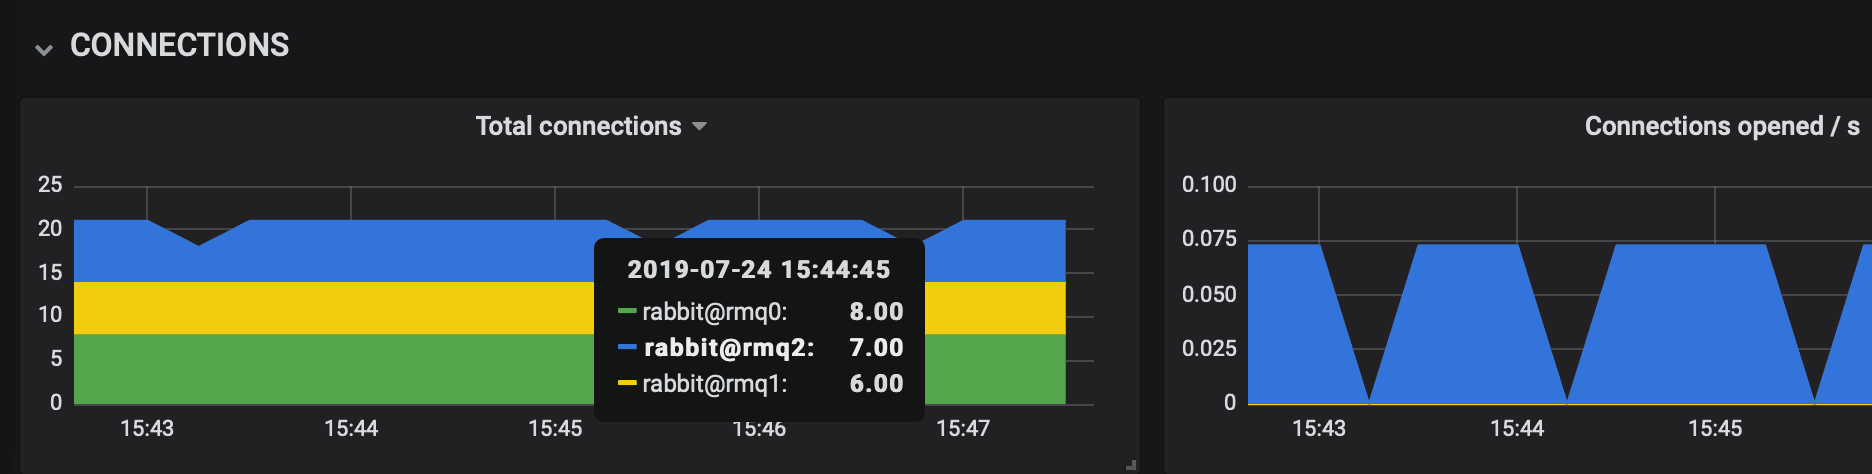
RabbitMQ exposes Prometheus metrics through the rabbitmq_prometheus plugin, and the RabbitMQ team publishes Grafana dashboards for them. This is the go-to stack for long-term metrics, dashboards and alerting, but it does not look at messages.
Strengths
- Best-in-class long-term metrics and alerting
- Official RabbitMQ dashboards available
- One place to monitor RabbitMQ next to the rest of your stack
Limitations
- Metrics only: cannot browse, search or replay messages
- Several components to run and maintain
- Tells you that a queue is growing, not which messages are stuck
Best for: Production monitoring and alerting across clusters, as a complement to a debugging tool. See Grafana + Prometheus alternatives.
FAQ
Yes. The Management UI is free and bundled with RabbitMQ, RabbitScout is a free open-source web dashboard, and rabbitmqadmin is a free CLI. Paid desktop tools like RabbitGUI and QueueExplorer add safer message browsing, search and replay.
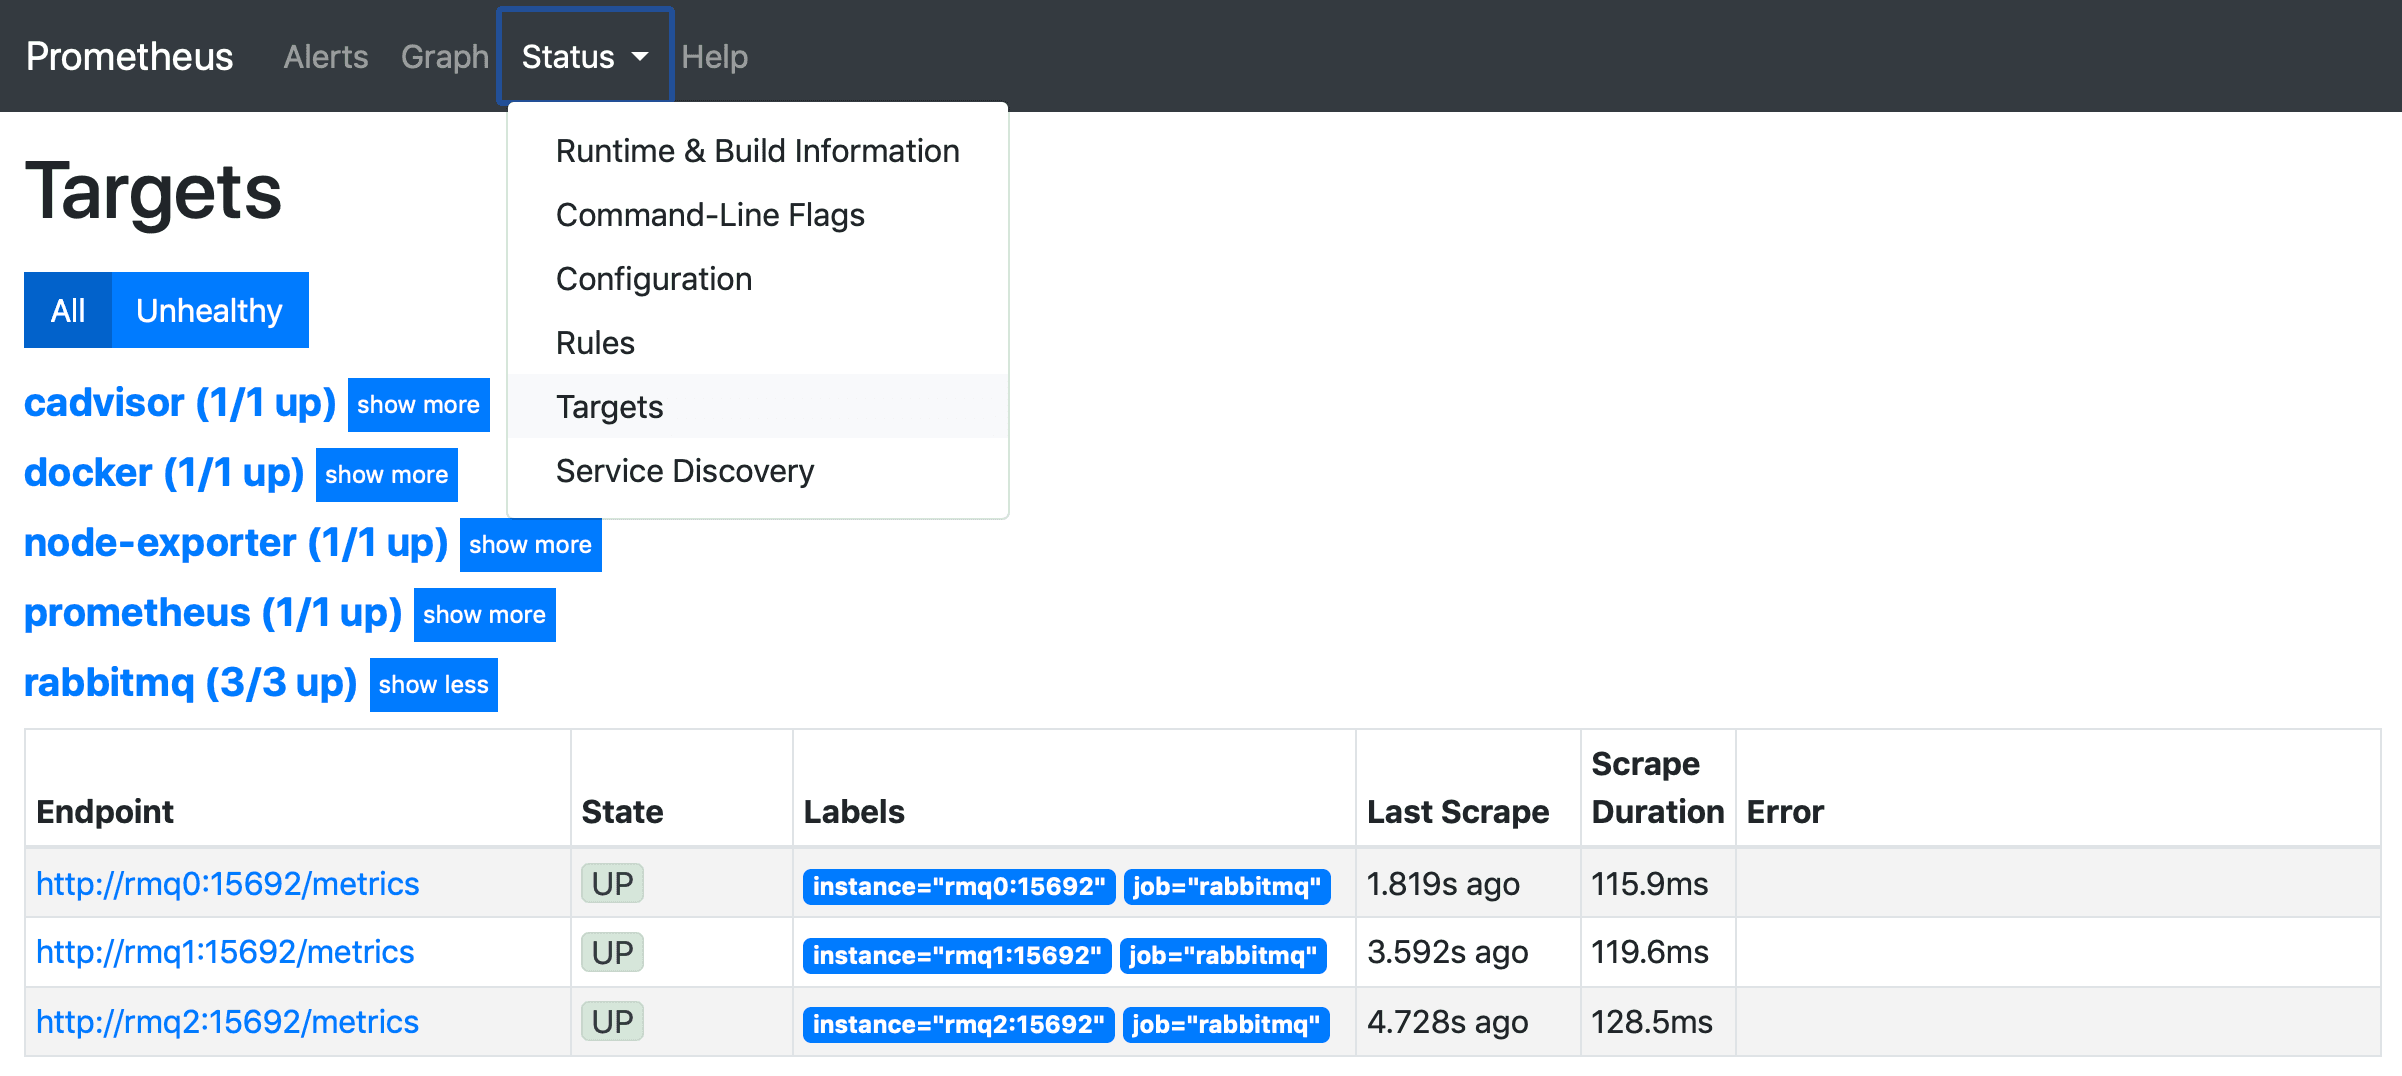
Almost all of them do, including RabbitGUI, QueueExplorer and RabbitScout, because they use the management HTTP API. Enable it with rabbitmq-plugins enable rabbitmq_management.
A tool that can copy messages out of a queue, filter them and republish a selection: RabbitGUI and QueueExplorer both do this. The Management UI can only move a whole queue with the shovel plugin.
More comparisons
Facts last verified on 2026-11-02. Sources: rabbitgui.com, RabbitMQ docs: Management Plugin, Cogin: pricing, Cogin: RabbitMQ GUI, GitHub: Ralve-org/RabbitScout, Chrome Web Store listing, RabbitMQ docs: management CLI, RabbitMQ docs: Prometheus and Grafana. Spotted something outdated? Email nicolas@tggl.io and we will fix it.