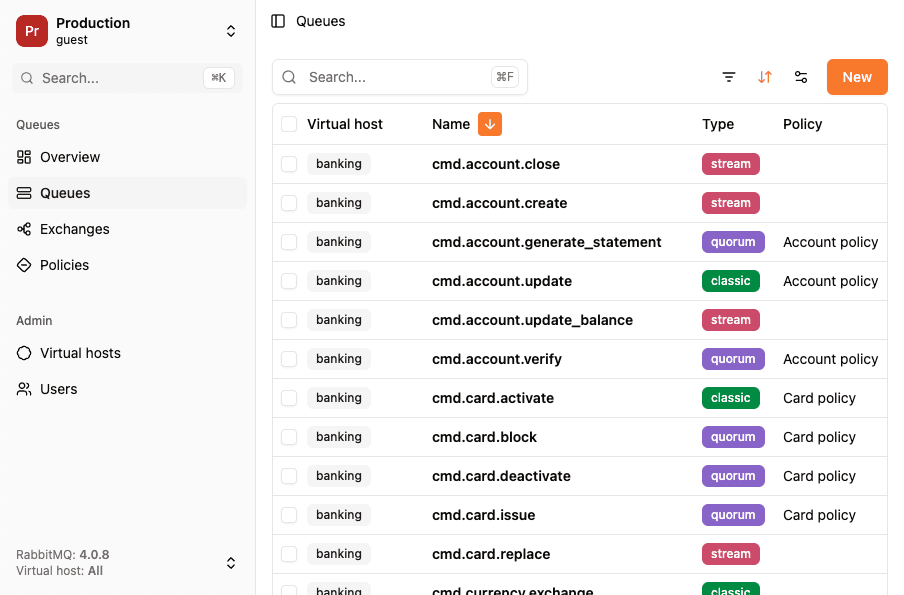
The RabbitMQ Management UI is the web interface that ships with RabbitMQ. It shows your queues, exchanges, connections and message rates, and lets you create, delete and purge things without writing code. This guide covers how to turn it on, how to reach it, what each tab does, and where it stops being enough.
Quick answer
Enable the plugin, then open port 15672 in your browser:
rabbitmq-plugins enable rabbitmq_managementhttp://localhost:15672On a fresh install, log in with guest / guest. That user only works from localhost (see RabbitMQ default login). If you use Docker, pick an image tag that ends in -management and map port 15672:
docker run -d --name rabbitmq -p 5672:5672 -p 15672:15672 rabbitmq:4-managementWhat is the RabbitMQ Management UI?
The Management UI is a plugin called rabbitmq_management. It adds two things on the same port, 15672:
- a web interface for humans, the one you see in the browser;
- an HTTP API for scripts and tools. The web UI is itself a client of that API, so anything you can click, you can also automate. See the RabbitMQ monitoring API for the endpoints.
It's the tool most people use to look inside RabbitMQ, because it's free, built in, and works with every client library. It's also showing its age, which we'll get to in the limits section.
How to enable the management plugin
On a server or a local install
The plugin ships with RabbitMQ but isn't enabled by default on package installs (Debian, RPM, Homebrew, Windows installer):
rabbitmq-plugins enable rabbitmq_managementNo restart is needed. To check which plugins are on:
rabbitmq-plugins listEnabled plugins are marked [E*] (explicitly enabled) or [e*] (enabled as a dependency). To turn it off again, run rabbitmq-plugins disable rabbitmq_management.
In Docker
The official image comes in two flavors. rabbitmq:4 has no management plugin. rabbitmq:4-management has it enabled. Use the -management tag and publish port 15672:
services:
  rabbitmq:
    image: rabbitmq:4-management
    ports:
      - '5672:5672'   # AMQP
      - '15672:15672' # Management UI and HTTP API
    environment:
      RABBITMQ_DEFAULT_USER: admin
      RABBITMQ_DEFAULT_PASS: change_me
If you set RABBITMQ_DEFAULT_USER, the guest user is never created, so log in with the credentials you set. The full setup is in RabbitMQ with Docker and Docker Compose.
On Kubernetes
The RabbitMQ Cluster Operator enables the management plugin by default. The UI is served by the cluster's Service on port 15672. To reach it from your machine:
kubectl port-forward service/my-rabbit 15672:15672Then open http://localhost:15672. The operator generates the default user. Read its credentials from the my-rabbit-default-user secret.
On managed services
Hosted RabbitMQ providers enable the UI for you:
- CloudAMQP: a "RabbitMQ Manager" button on the instance page opens the UI. See how to log in to a CloudAMQP instance.
- Amazon MQ for RabbitMQ: the broker details page links to the "RabbitMQ web console". It uses the broker user you created with the broker.
How to access the Management UI
The default URL is:
http://<host>:15672Port 15672 is for the UI and the HTTP API. Port 5672 is for AMQP clients. Opening http://localhost:5672 in a browser won't show the UI. The RabbitMQ ports guide lists every port and what it's for.
Change the port
In rabbitmq.conf:
management.tcp.port = 15673Serve it behind a reverse proxy
If you expose the UI under a path, for example https://ops.example.com/rabbitmq/, tell RabbitMQ about the prefix so links and API calls resolve:
management.path_prefix = /rabbitmqThe proxy must forward /rabbitmq/ to port 15672 with the prefix kept. It also must not decode the %2F in URLs: the default virtual host / is encoded as %2F in every API path, and a proxy that decodes it breaks most pages.
Enable HTTPS
To serve the UI over TLS, configure the listener on port 15671:
management.ssl.port       = 15671
management.ssl.cacertfile = /path/to/ca_certificate.pem
management.ssl.certfile   = /path/to/server_certificate.pem
management.ssl.keyfile    = /path/to/server_key.pem
You can run both listeners, or keep only the TLS one by removing management.tcp.port.
Logging in: users, tags and the guest restriction
Any RabbitMQ user can authenticate, but only users with a management tag can use the UI. The tag sets what they see:
| Tag | What the user can do in the UI |
|---|---|
management | See and manage the virtual hosts they have permissions on |
policymaker | Same as management, plus manage policies and parameters in those virtual hosts |
monitoring | See all connections, channels and node metrics, across every virtual host |
administrator | Everything, including users, virtual hosts, permissions and global settings |
Create an administrator for remote access:
rabbitmqctl add_user admin 'a-strong-password'
rabbitmqctl set_user_tags admin administrator
rabbitmqctl set_permissions -p / admin ".*" ".*" ".*"
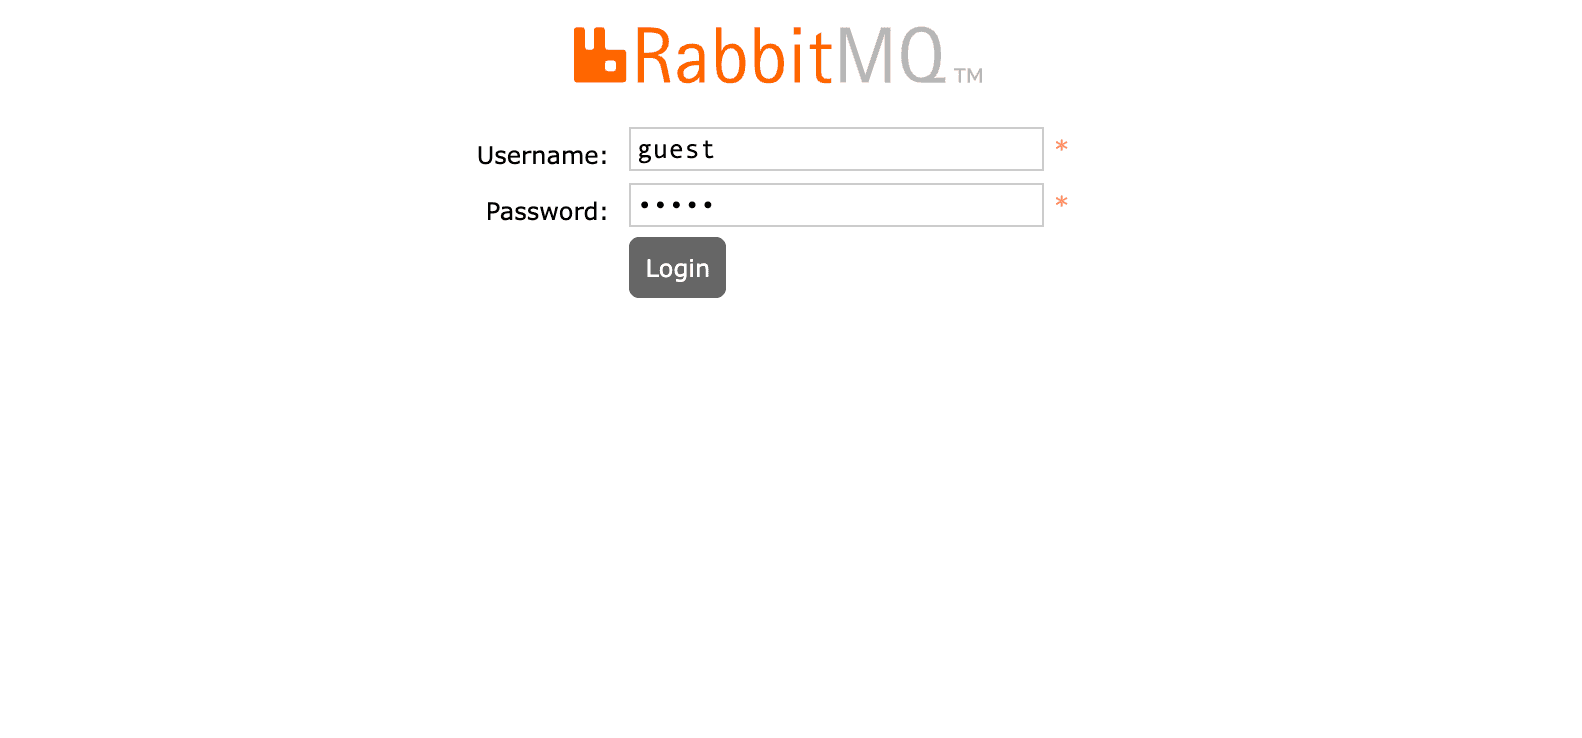
Why guest fails remotely: RabbitMQ restricts the guest user to loopback connections (loopback_users.guest = true by default). Logging in as guest from another machine, or from your laptop to a server, fails with "Login failed". Create a real user rather than lifting that restriction. The default login guide covers both options.
A tour of the Management UI, tab by tab
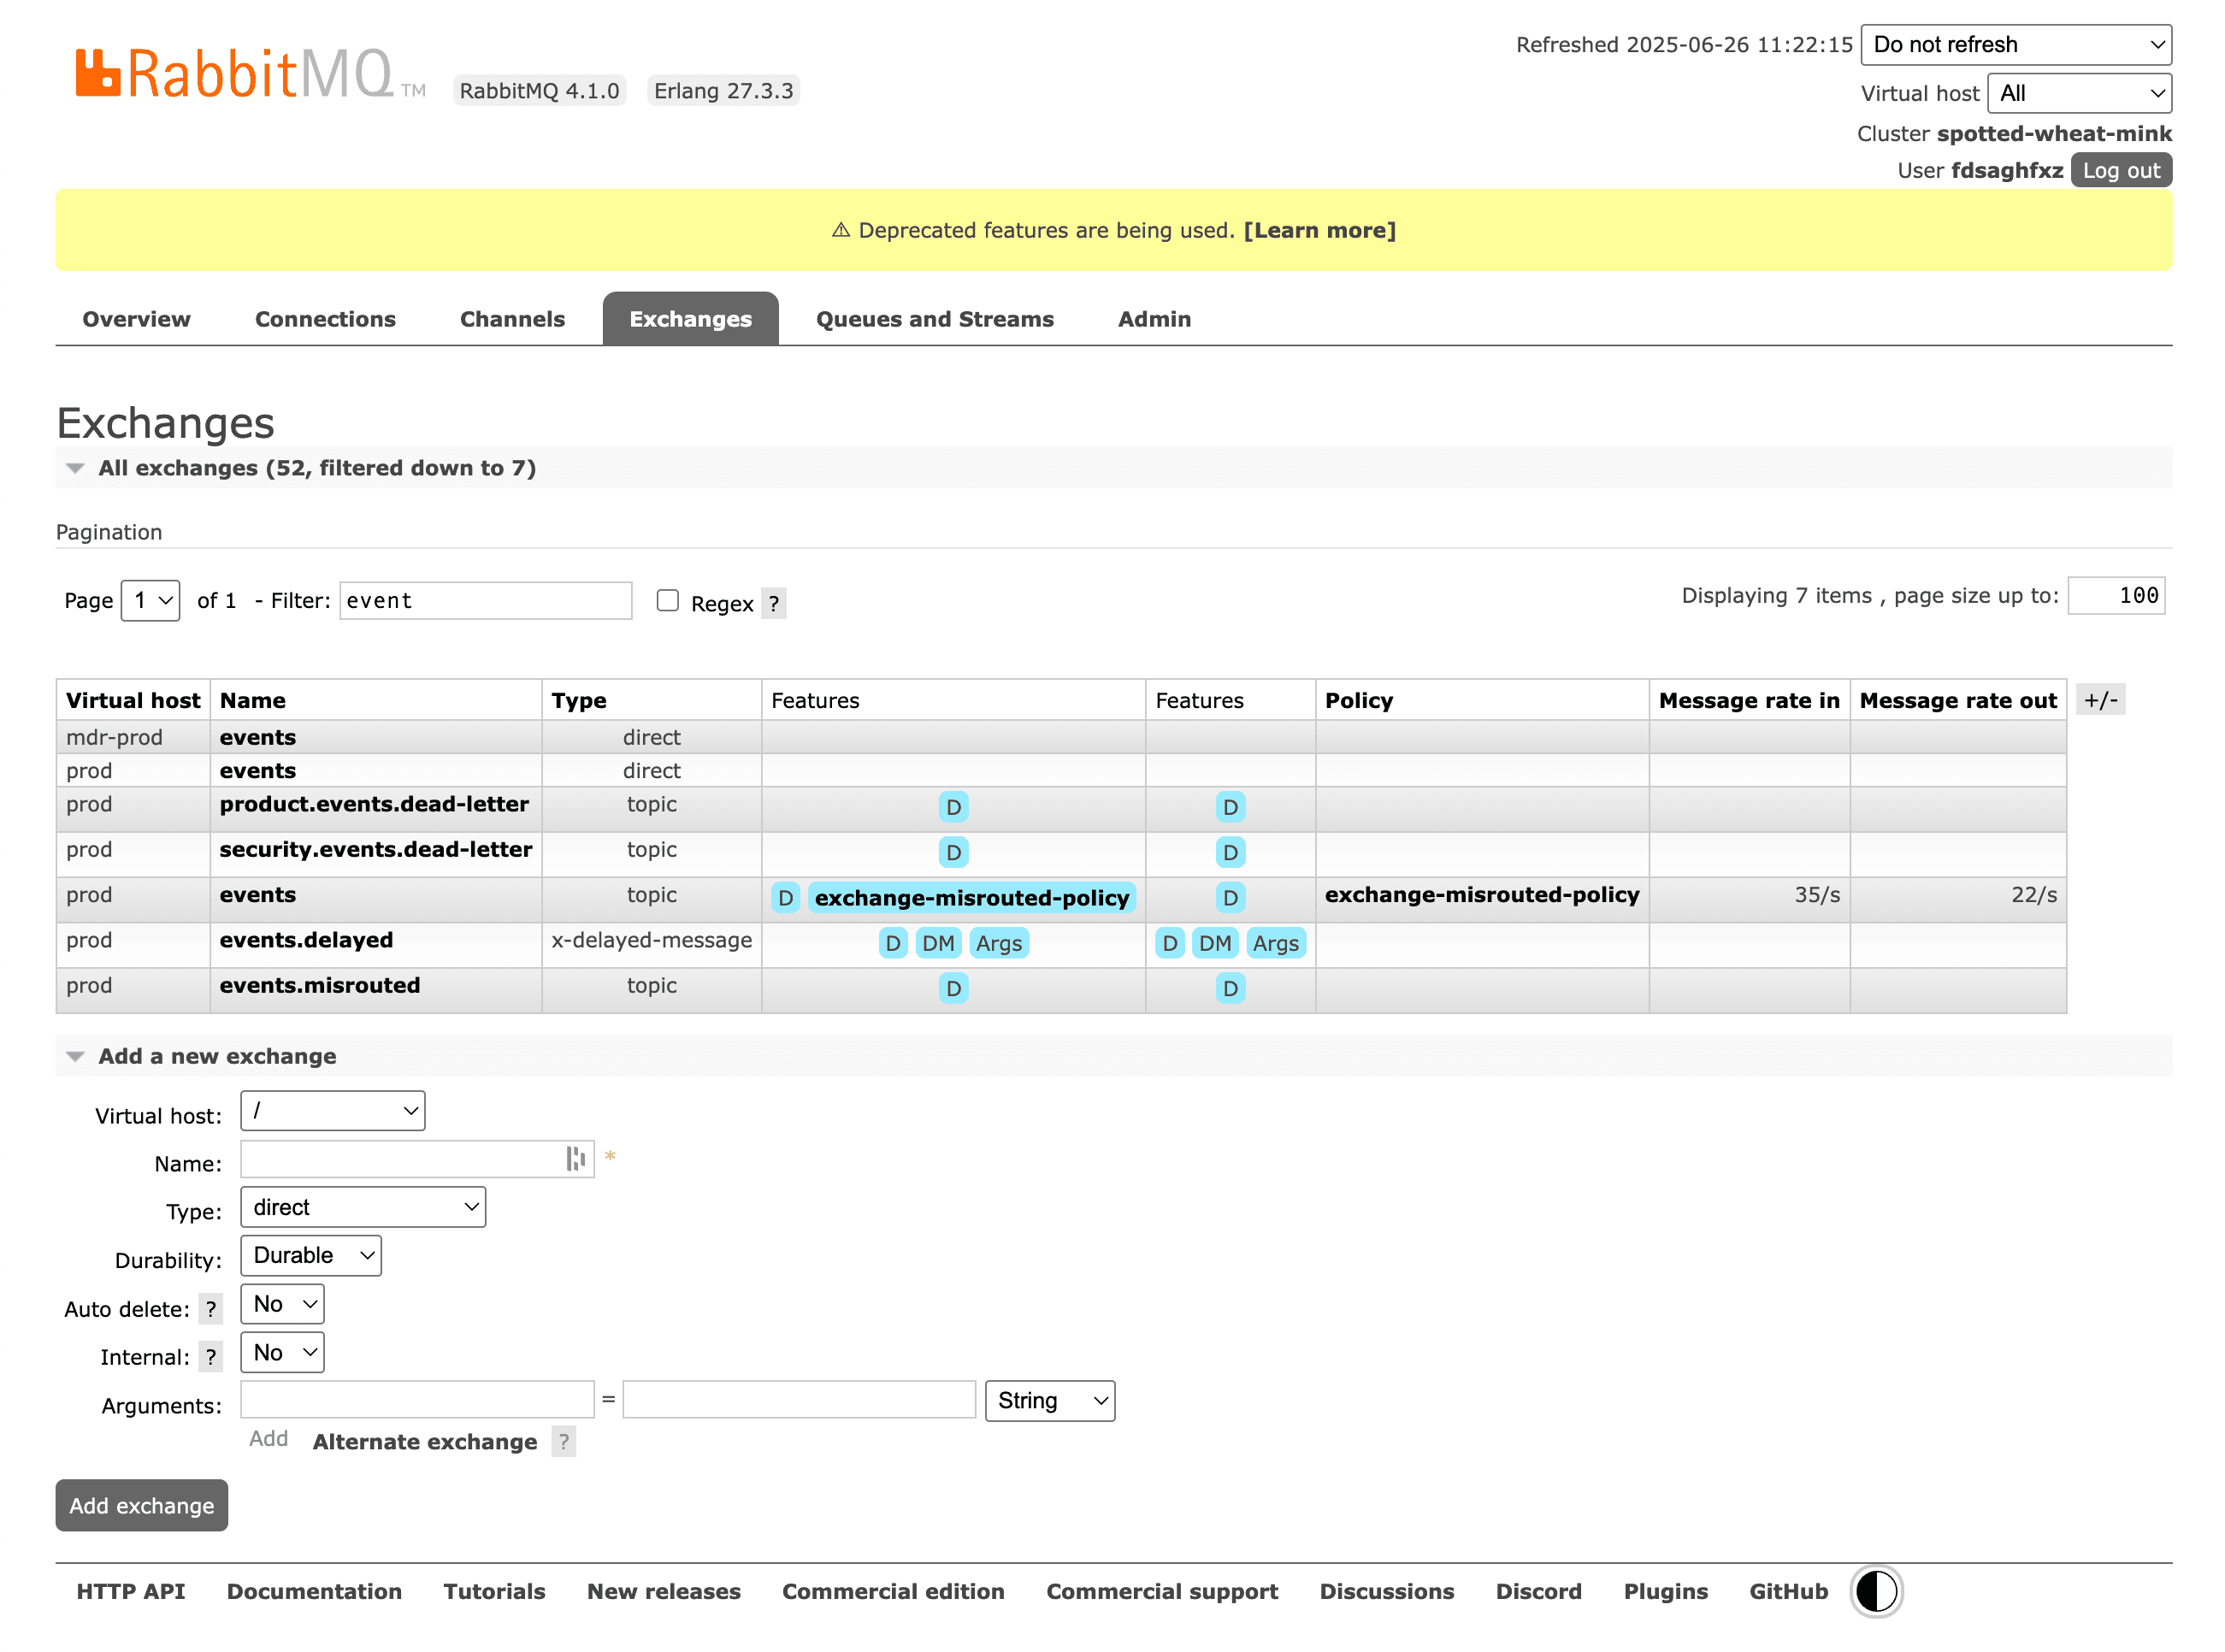
The top of every page shows the RabbitMQ and Erlang versions, the cluster name, the logged-in user, and two dropdowns: one for the refresh interval (5 seconds by default) and one to filter everything by virtual host.

Overview
The health of the whole cluster on one page:
- Totals: the number of messages ready and unacknowledged, with a chart over time.
- Message rates: publish, deliver, acknowledge, redeliver and more, cluster-wide.
- Global counts: connections, channels, exchanges, queues and consumers.
- Nodes: one row per node with memory, disk space, file descriptors, Erlang processes and uptime. A red cell here (memory or disk alarm) means publishers are being blocked.
- Ports and contexts: which listeners are open (5672, 15672, 25672…).
- Export and import definitions: download or upload a JSON file with all users, virtual hosts, queues, exchanges, bindings and policies. It's the quickest way to back up or copy a broker's topology.
Connections
Every client TCP connection: the client's address, the user, the protocol (AMQP 0-9-1, AMQP 1.0, MQTT, STOMP), TLS, state, and network rates. Click one to see its channels and client properties, such as the library name and version, or the connection_name your app set. You can also force-close a connection from here, which helps when a stuck client holds unacked messages.
Channels
The channels opened on those connections, with their prefetch count, the number of unacknowledged messages, and per-channel rates. A channel with a growing unacked count and no acks usually points to a consumer that crashed without closing, or one that forgot to ack. See message acknowledgment explained.
Exchanges
All exchanges with their type (direct, fanout, topic, headers, or plugin types like x-delayed-message), features (D for durable, AD for auto-delete, I for internal) and rates. Click one to see its bindings, add a binding, publish a test message, or delete it. The exchange types guide explains how each type routes.
Queues and Streams
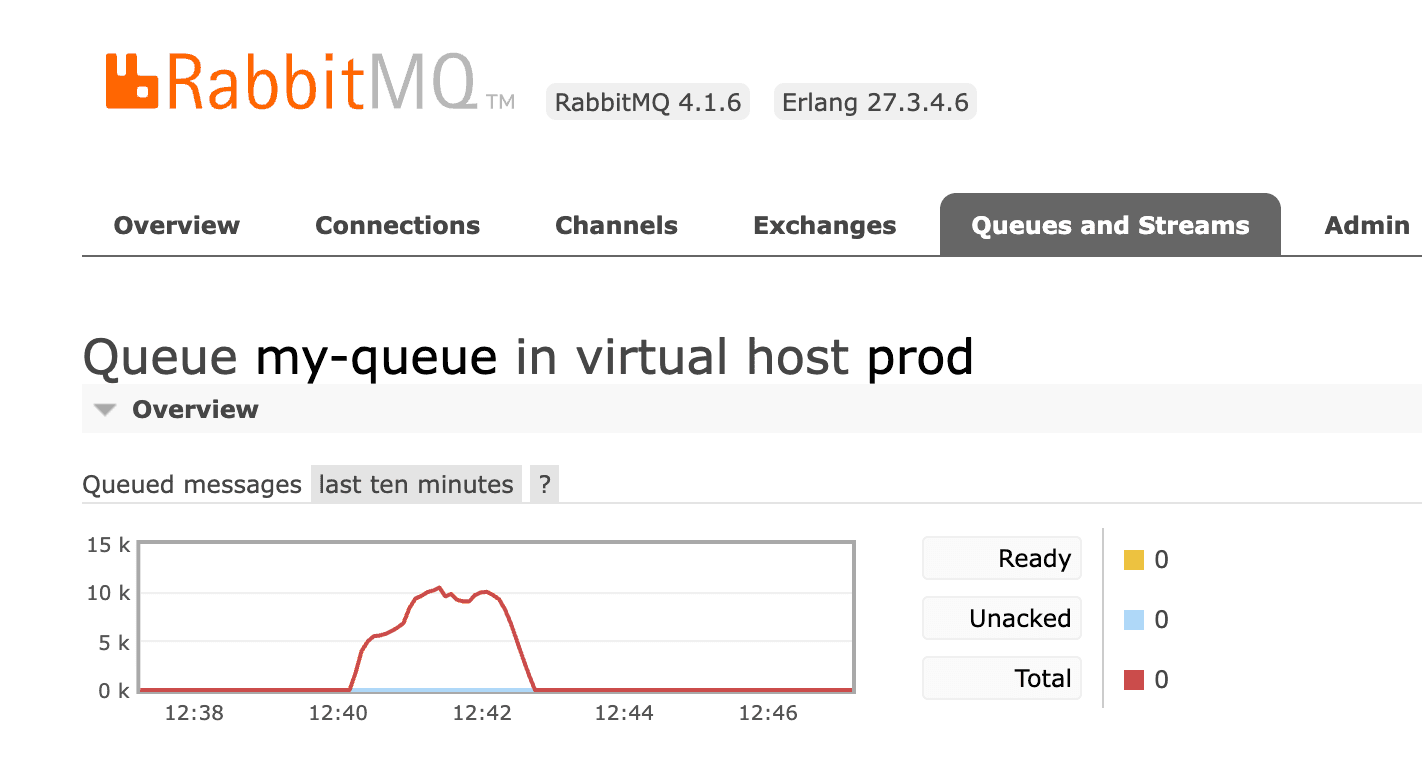
The page you'll use most. Each queue shows its type (classic, quorum, stream), features (durable, TTL, dead-letter exchange, max length…), state, ready / unacked / total message counts and rates.
Click a queue to open its detail page:
- charts of queued messages and message rates;
- its consumers and their prefetch;
- its bindings, with a form to add more;
- Publish message and Get messages forms (see below);
- Move messages (when the
rabbitmq_shovel_managementplugin is enabled), Delete and Purge.
Admin
The administrator area, with a side menu:
- Users: create users, set tags and passwords.
- Virtual Hosts: create and delete vhosts, set limits.
- Feature Flags and Deprecated Features: what to enable before your next upgrade.
- Policies and Operator Policies: apply settings like dead-lettering, TTL or max length to queues that match a pattern. When two policies match, only the highest priority one applies. Debugging policies covers the traps.
- Limits: per-vhost and per-user connection and queue limits.
- Cluster: rename the cluster.
Plugins add their own pages here, for example Shovel and Federation status.
Common tasks in the Management UI
Create a queue
In Queues and Streams, open Add a new queue. Pick the virtual host, the type (prefer quorum for anything that matters), a name, and optional arguments like x-dead-letter-exchange or x-message-ttl. Prefer policies over arguments for settings you may want to change later: queue arguments can't be changed once the queue exists.
Bind a queue to an exchange
Open the exchange (or the queue), find Add binding, then enter the other side and a routing key. For topic exchanges, * matches one word and # matches zero or more.
Publish a test message
Open a queue or an exchange and expand Publish message. Set a routing key, headers, properties (content_type, delivery_mode = 2 for persistent) and a payload.
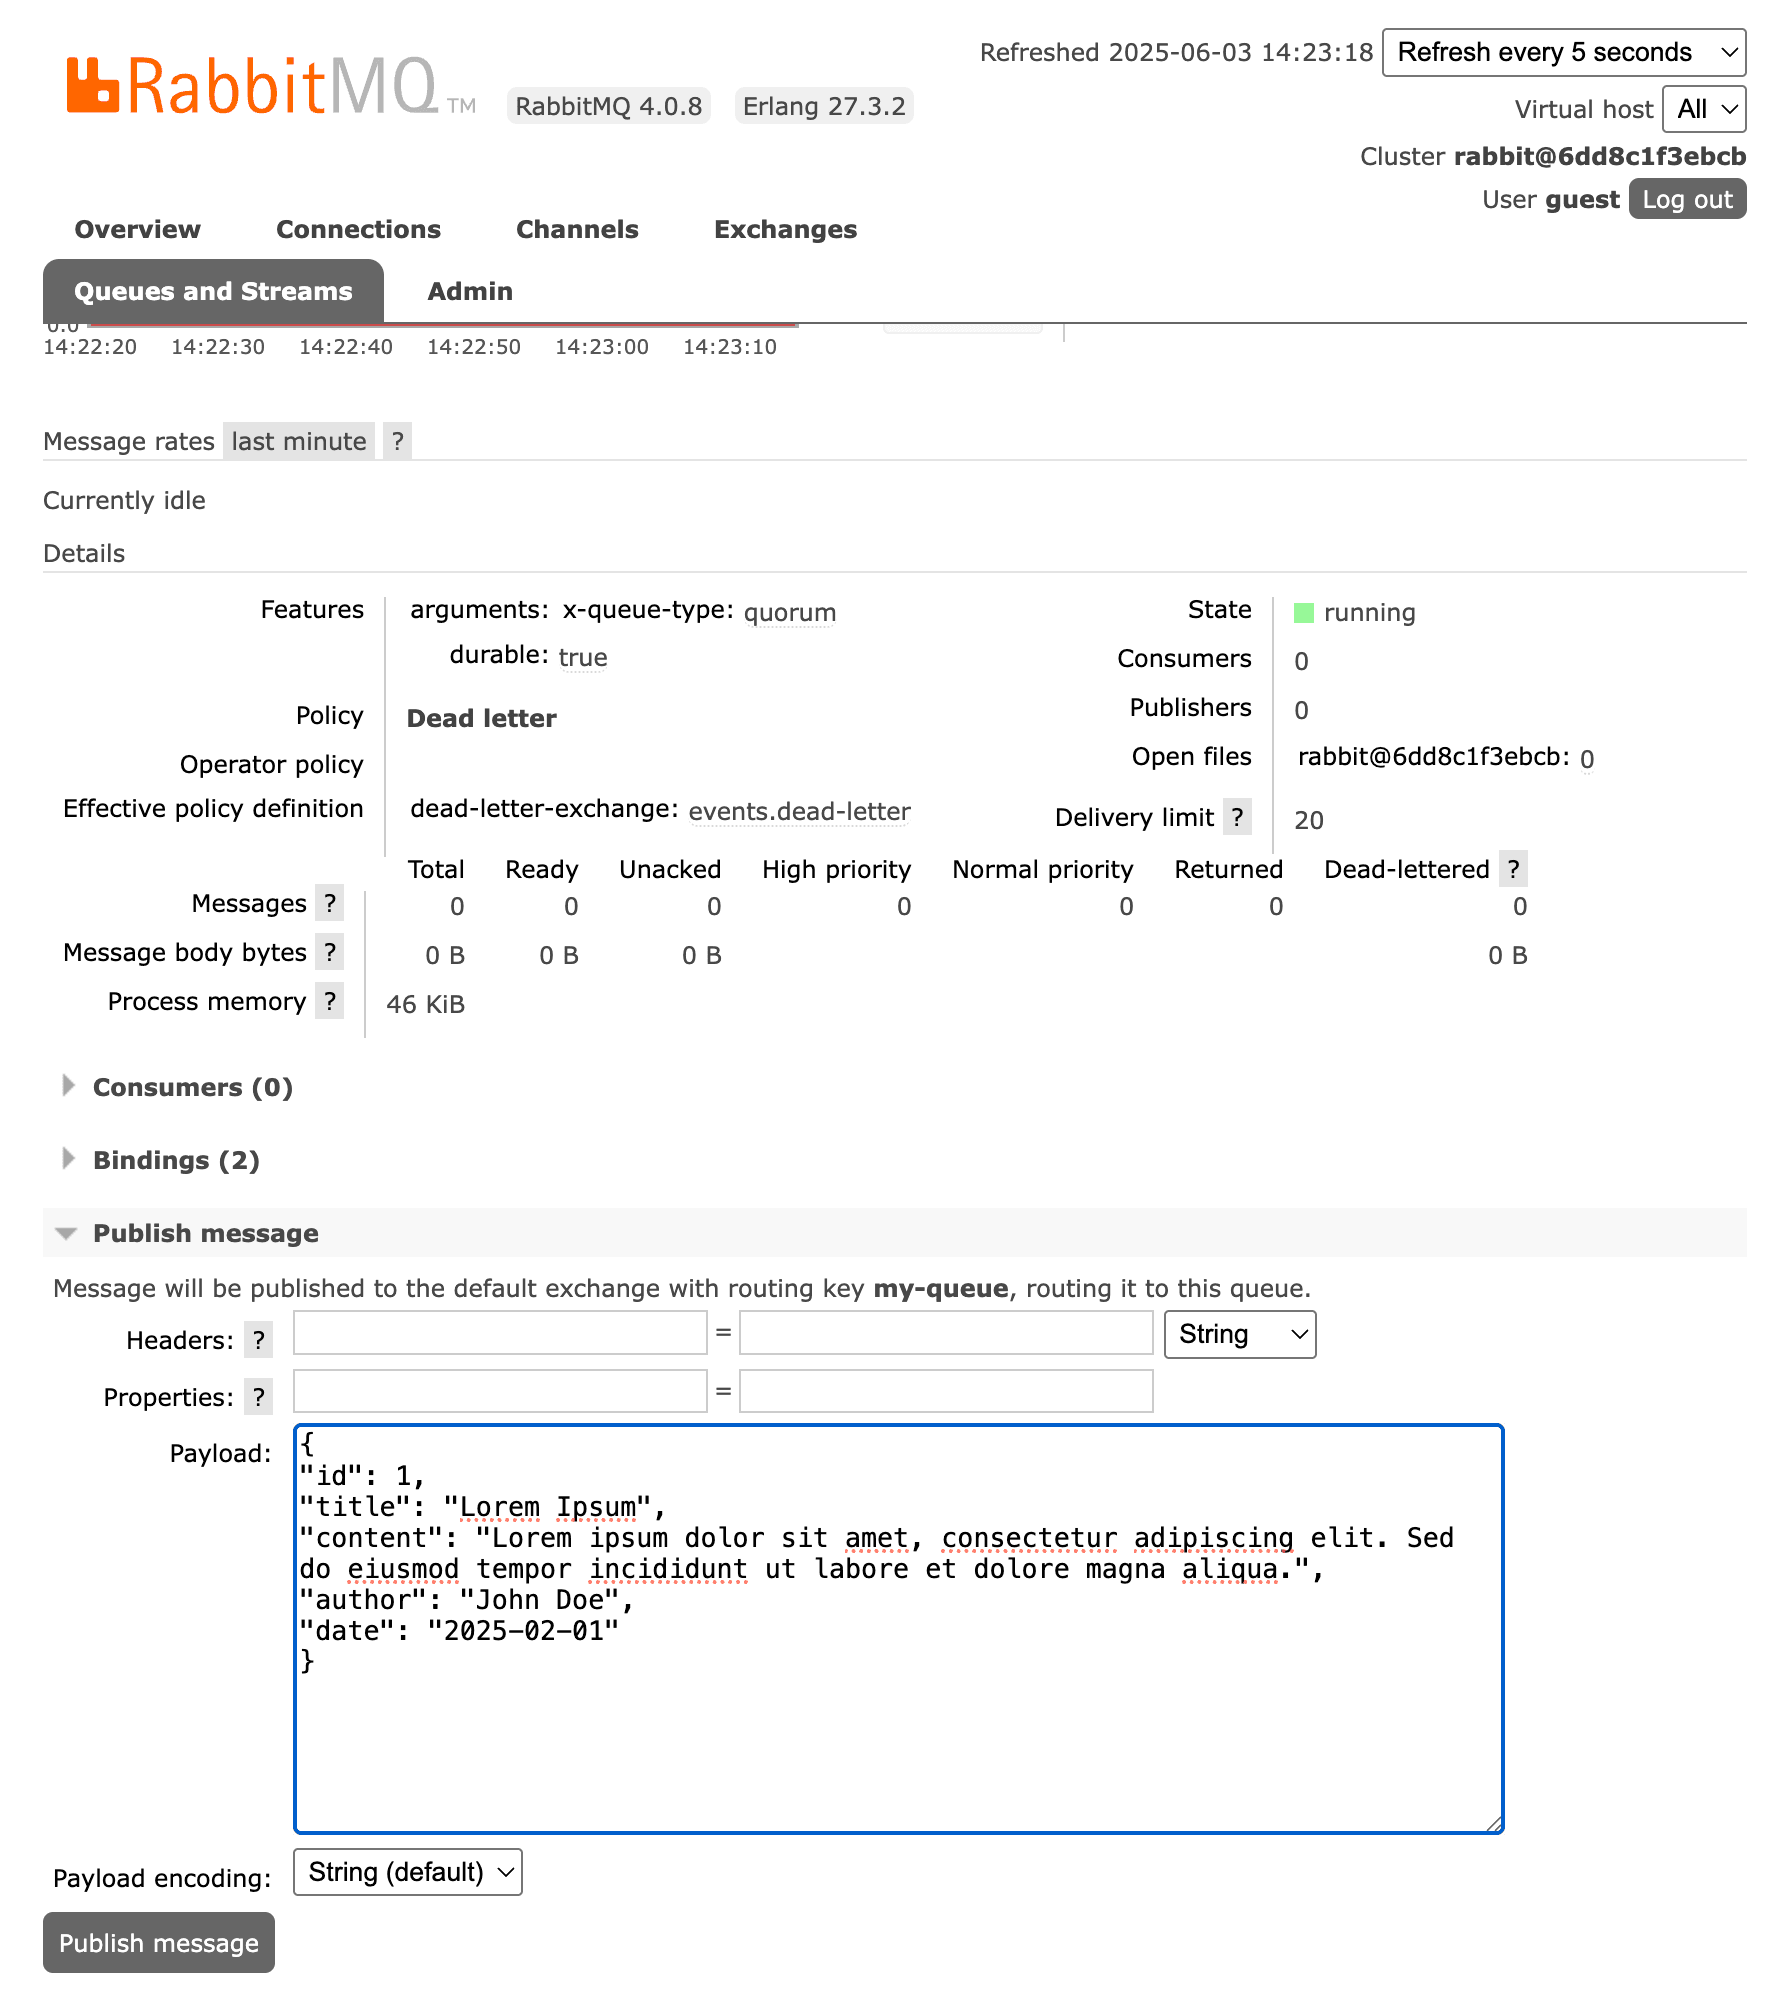
Publishing from a queue page goes through the default exchange, with the queue name as routing key. To test real routing, publish from the exchange page instead. For anything beyond a one-off test, see how to manually publish messages to RabbitMQ.
Get messages (read this before you click)
Get messages on a queue page is the only way to read message contents in the UI, and it is not a read-only peek. It consumes messages, then acts on them according to the Ack mode you choose:
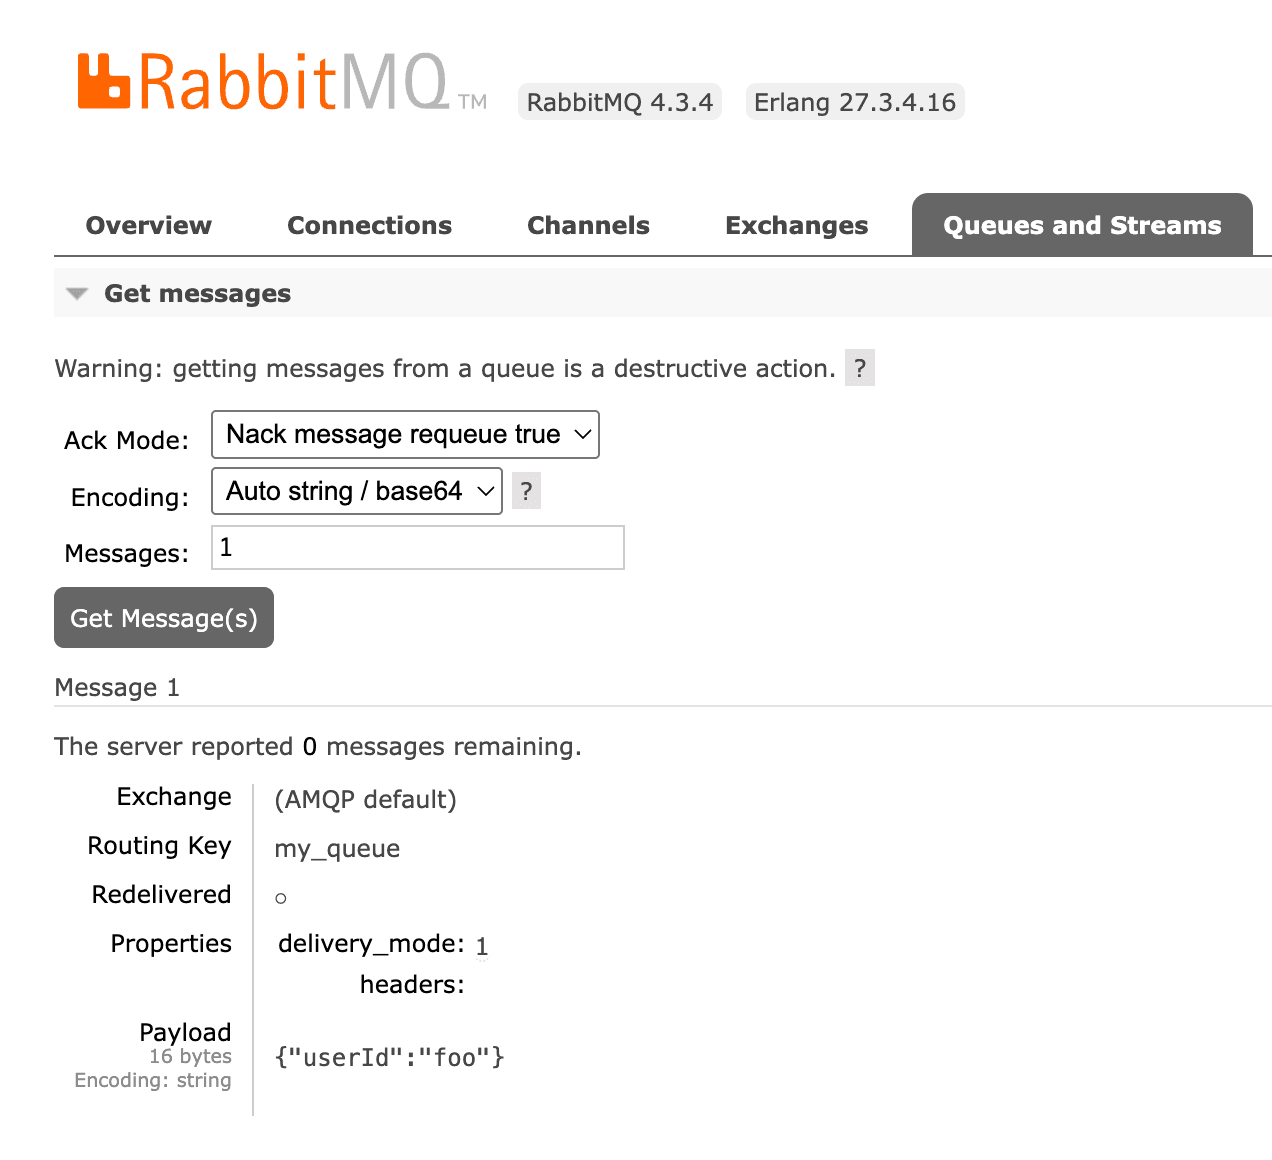
- Nack message requeue true (the default): the messages are put back. They are marked as redelivered, can come back in a different position, and on quorum queues the delivery count goes up, which can push messages to the dead-letter queue if you set a delivery limit.
- Automatic ack: the messages are removed from the queue for good.
- Reject requeue false: the messages are removed, and dead-lettered if the queue has a dead-letter exchange.
It also only shows a handful of messages at a time, with no search. If you need to look through a queue, read how to browse RabbitMQ messages without consuming them.
Purge a queue
Purge Messages at the bottom of the queue page deletes every ready message. Unacked messages stay until their consumer acks or disconnects. There's no undo.
Add a policy
Admin → Policies → Add / update a policy. Give a name, a regex pattern (^orders\. for every queue starting with orders.), what it applies to, a priority, and definitions such as dead-letter-exchange = dlx. Policies apply live to existing queues. That's the main reason to prefer them over queue arguments.
The management HTTP API
Everything the UI shows comes from the HTTP API on the same port, so you can script it with the same credentials:
curl -u admin:password http://localhost:15672/api/queues/%2F/ordersThis is how monitoring scripts, CI checks and desktop clients get their data. The RabbitMQ monitoring API guide lists the useful endpoints and metrics.
Limits of the RabbitMQ Management UI
The Management UI is reliable and always there, but it was designed as an admin console, not a debugging tool. The usual pain points:
- You can't browse messages. "Get messages" consumes and requeues, a few at a time, with no search or filter. Dead-letter queues are where this hurts most.
- No replay. Republishing failed messages to their original queue means copying payloads by hand, one by one.
- Short metrics history. Charts cover the last minutes to the last day, with coarser samples as you go back. Long-term trends need Prometheus and Grafana.
- One broker per tab. Every environment is a separate URL, a separate login and a separate tab.
- No routing overview. Bindings are listed per exchange or per queue, but there is no view of how a message travels through exchanges, bindings and dead-letter paths.
- Slow with many objects. With thousands of queues or connections, list pages take seconds to load and refresh.
If you're comparing options, we keep an up-to-date list of RabbitMQ Management UI alternatives, and a feature-by-feature RabbitGUI vs Management UI comparison.
Troubleshooting
The plugin is enabled but localhost:15672 doesn't load
- Check that the listener is up:
rabbitmq-diagnostics listenersshould listhttpon 15672. - Check you're on the right port: 15672 (HTTP), not 5672 (AMQP).
- If you changed
management.tcp.portor setmanagement.path_prefix, use the new port or path. - On a remote server, check the firewall or security group allows 15672.
Docker: connection refused on 15672
- The image tag must end in
-management. Plainrabbitmq:4has no UI. - Publish the port:
-p 15672:15672. - Wait for startup. The UI is up a few seconds after the container starts.
docker logs rabbitmqshowsServer startup completewhen it's ready.
"Login failed"
You're probably logging in as guest from outside localhost, or the image created a different default user because RABBITMQ_DEFAULT_USER is set. Also check the user has a management tag: a user with no tags can connect over AMQP but can't log in to the UI.
The UI is slow with thousands of queues
- Use the filter and pagination on list pages, and a larger refresh interval (or "Do not refresh").
- Fine-grained per-object rates are expensive. Leave
management.rates_modeat its default (basic) instead ofdetailed. - For monitoring at scale, scrape the Prometheus endpoint (port 15692,
rabbitmq_prometheusplugin) rather than polling the management API.
Message rates and charts are empty
Statistics may be disabled. RabbitMQ 4 can run with management_agent.disable_metrics_collector = true, a common setting when Prometheus is the main monitoring tool. In that case the UI shows objects but no rates. Re-enable it, or read rates from Prometheus.
FAQ
What is the RabbitMQ Management UI URL?
http://localhost:15672 on a local install, or http://<server>:15672 on a server, once the rabbitmq_management plugin is enabled.
What is the default RabbitMQ Management UI username and password?
guest / guest, and only from localhost. On Docker, the RABBITMQ_DEFAULT_USER and RABBITMQ_DEFAULT_PASS variables replace it.
How do I enable the RabbitMQ management plugin?
Run rabbitmq-plugins enable rabbitmq_management. In Docker, use an image tag ending in -management, such as rabbitmq:4-management.
What port does the RabbitMQ Management UI use?
15672 for HTTP and 15671 for HTTPS. AMQP clients use 5672, not 15672.
Can I see message contents in the Management UI?
Only with "Get messages", which consumes messages and requeues or removes them depending on the ack mode. There is no read-only browse. Desktop clients like RabbitGUI copy messages locally so you can search them without affecting the queue.
Is the RabbitMQ Management UI safe to expose on the internet?
Avoid it. Keep it on a private network or behind a VPN or an authenticating reverse proxy, enable TLS on 15671, remove or restrict guest, and give each person their own user with the smallest tag they need.