RabbitMQ Management UI vs Grafana + Prometheus
An honest, feature-by-feature comparison of RabbitMQ Management UI and Grafana + Prometheus: message browsing, dead letters, live traffic, platforms and pricing.
Quick verdict
The Management UI keeps only short-term statistics and is not meant for alerting. Prometheus and Grafana are the recommended way to monitor RabbitMQ in production, while the Management UI stays useful for administration.
At a glance
| RabbitMQ Management UI | Grafana + Prometheus | |
|---|---|---|
| Type | Web UI | Monitoring stack |
| Runs on | Any browser | Self-hosted or Grafana Cloud, any browser |
| Price | Free (bundled with RabbitMQ) | Free (open source), Grafana Cloud has paid tiers |
| Open source | Yes (MPL 2.0) | Yes (AGPL-3.0 (Grafana), Apache-2.0 (Prometheus)) |
| Made by | RabbitMQ team (Broadcom) | Grafana Labs / Prometheus (open source) |
| Best for | Broker administration (users, permissions, policies) and quick checks when nothing else is installed. | Production monitoring and alerting across clusters, as a complement to a debugging tool. |
Feature by feature
| Capability | Management UI | Grafana |
|---|---|---|
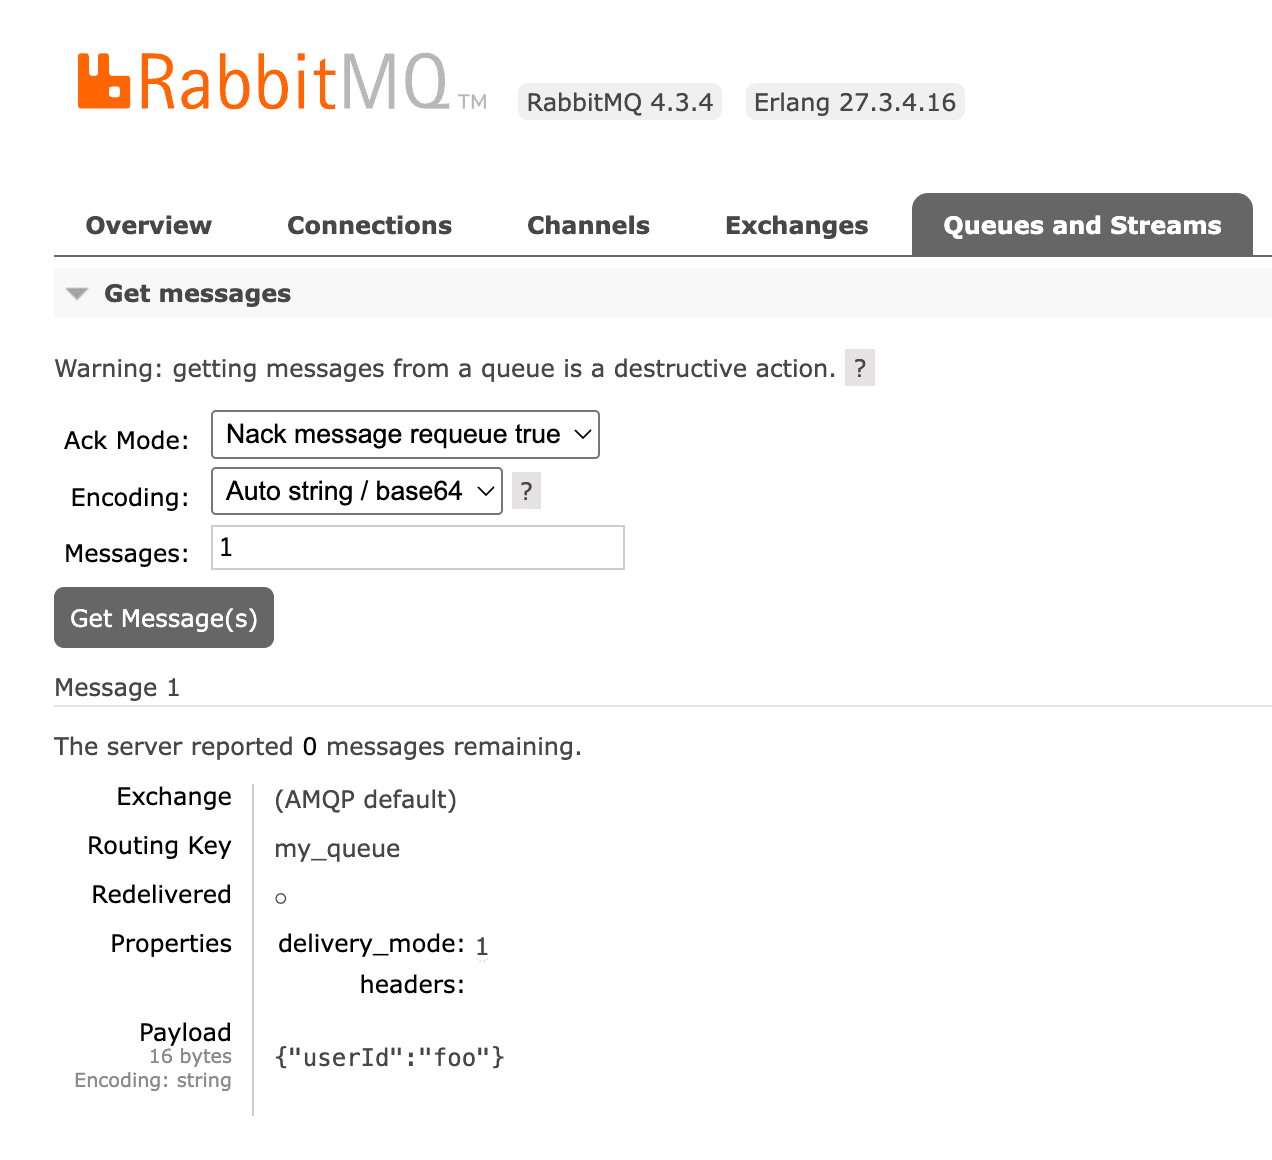
| Browse messages safelyLook at the messages sitting in a queue without losing them or disturbing consumers. | Partly"Get messages" consumes messages and optionally requeues them, which changes order and redelivery flags | No |
| Search & filter messagesFind specific messages by body, headers or properties instead of paging through them one by one. | NoNo message search or filtering | No |
| Replay dead lettersRe-publish failed or dead-lettered messages back to a queue or exchange. | PartlyOnly with the shovel plugin ("Move messages"), whole queue at a time | No |
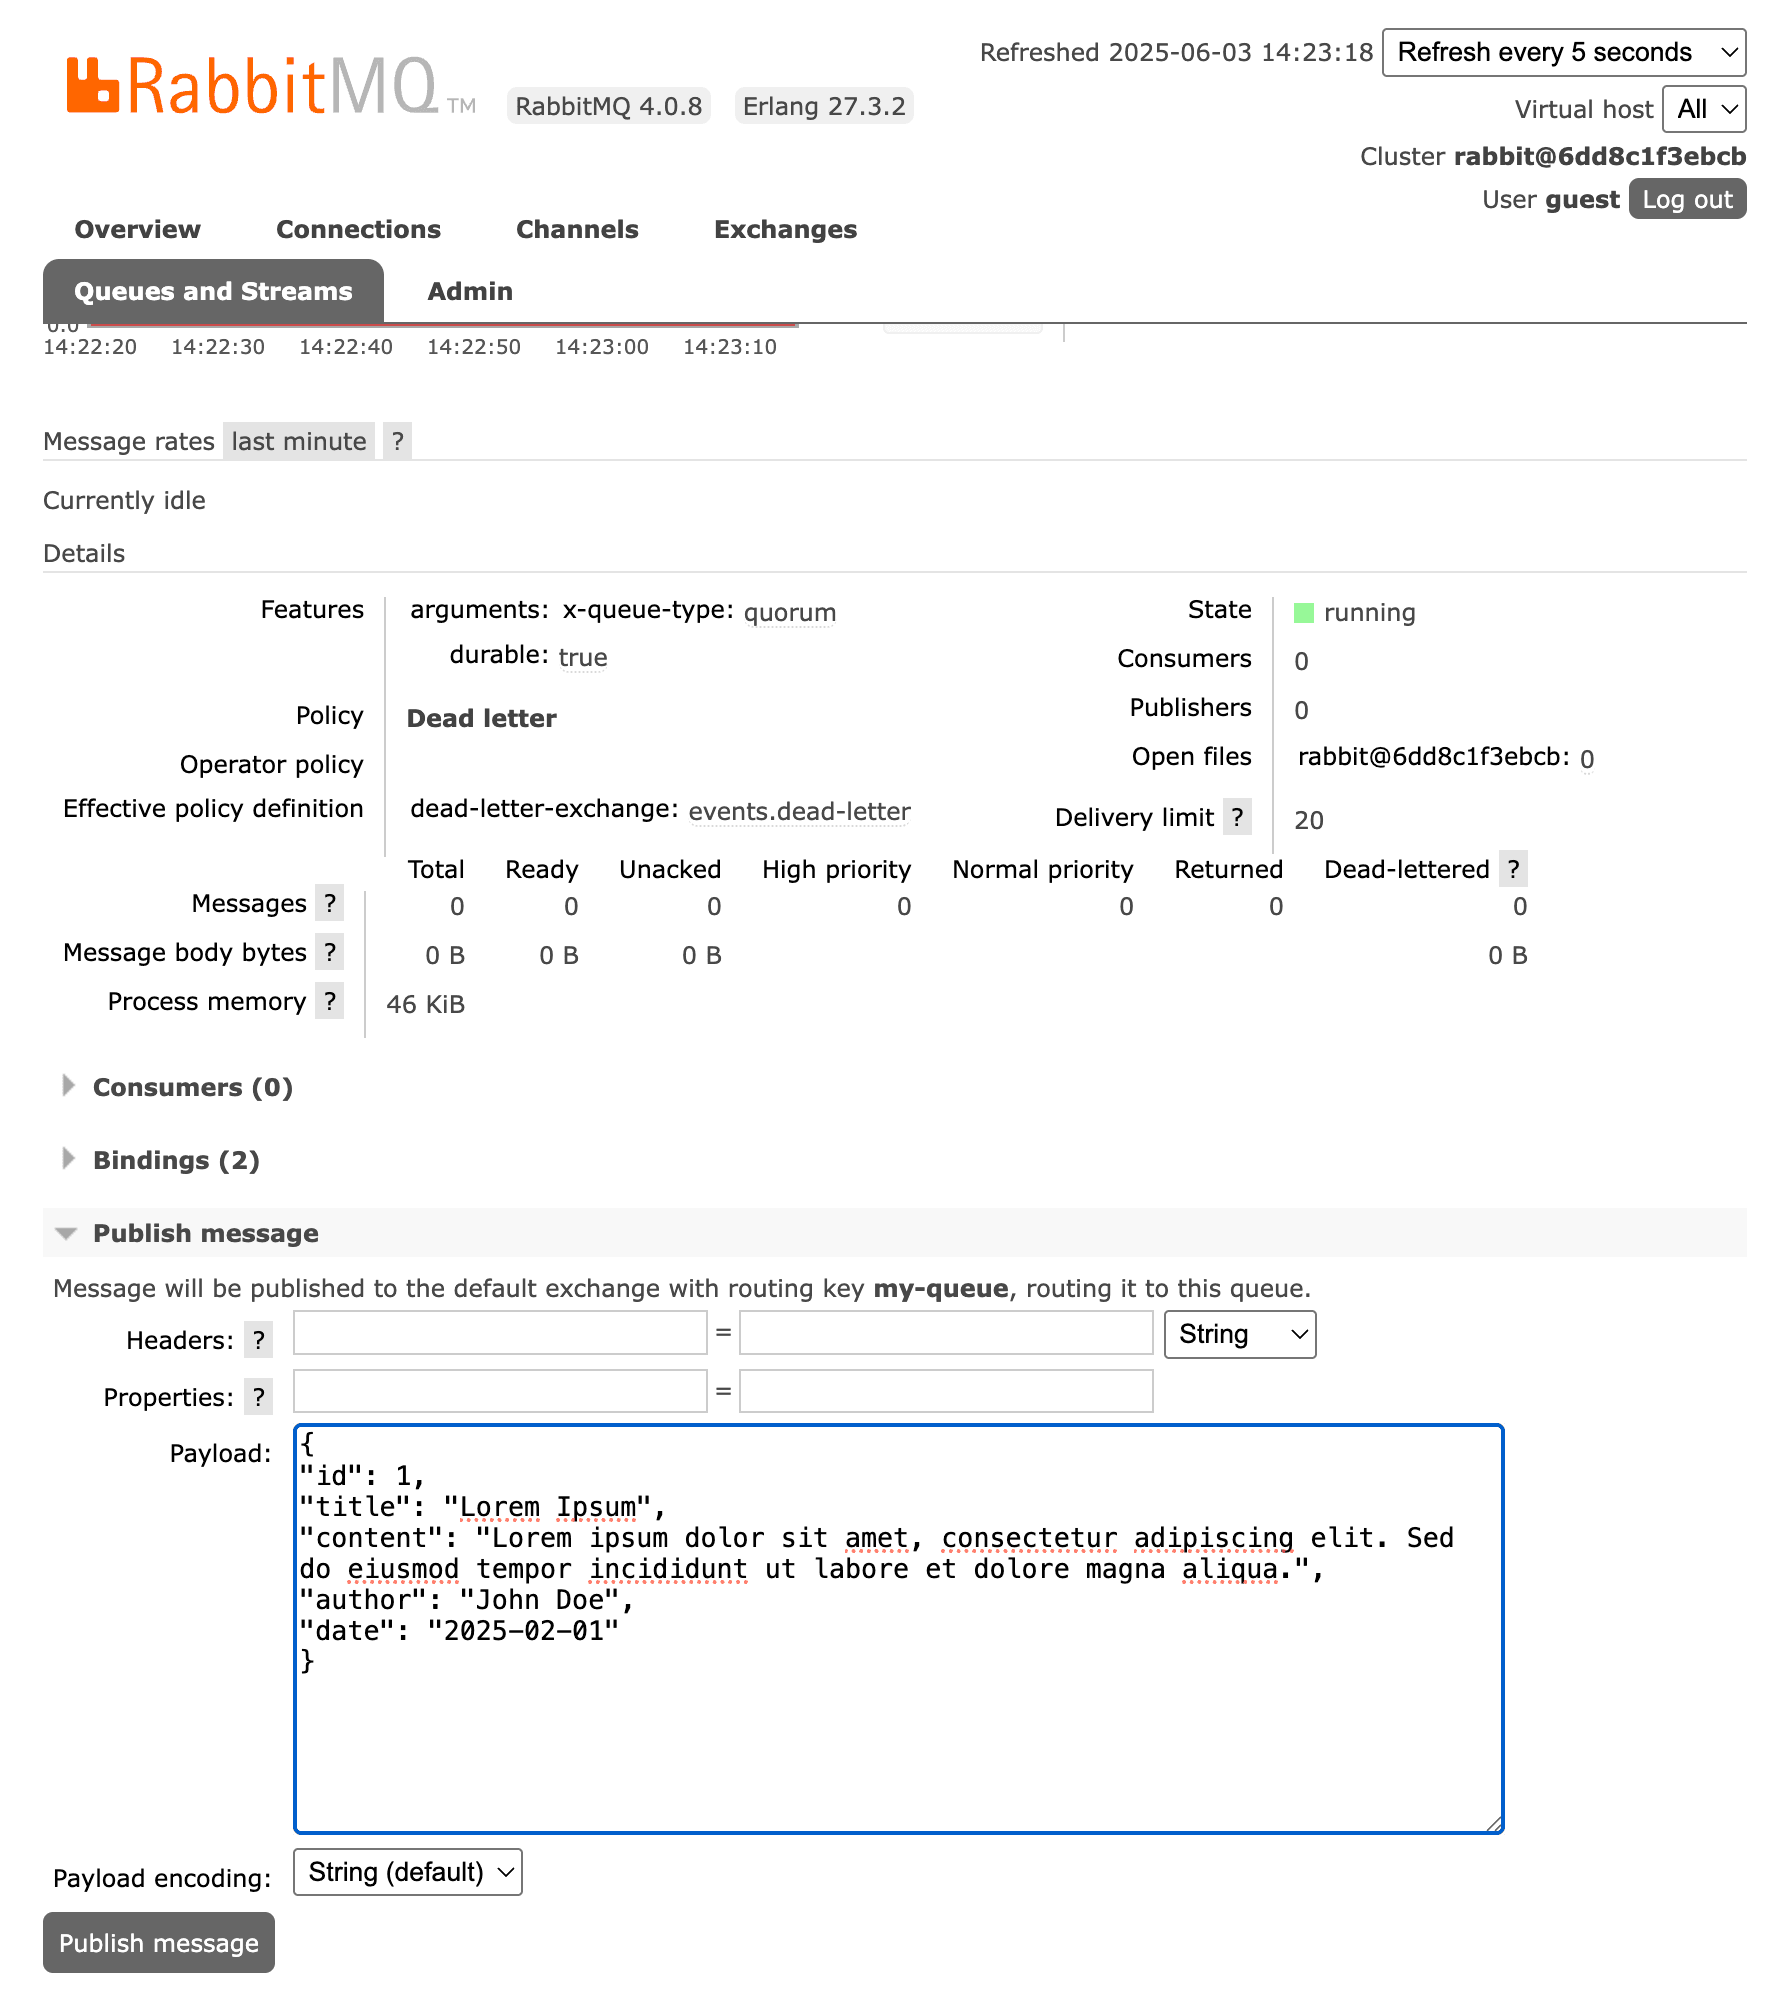
| Publish test messagesSend a message with custom headers and properties by hand. | YesBasic form with headers and properties | No |
| Watch live trafficSee messages as they flow through a queue without consuming them. | No | No |
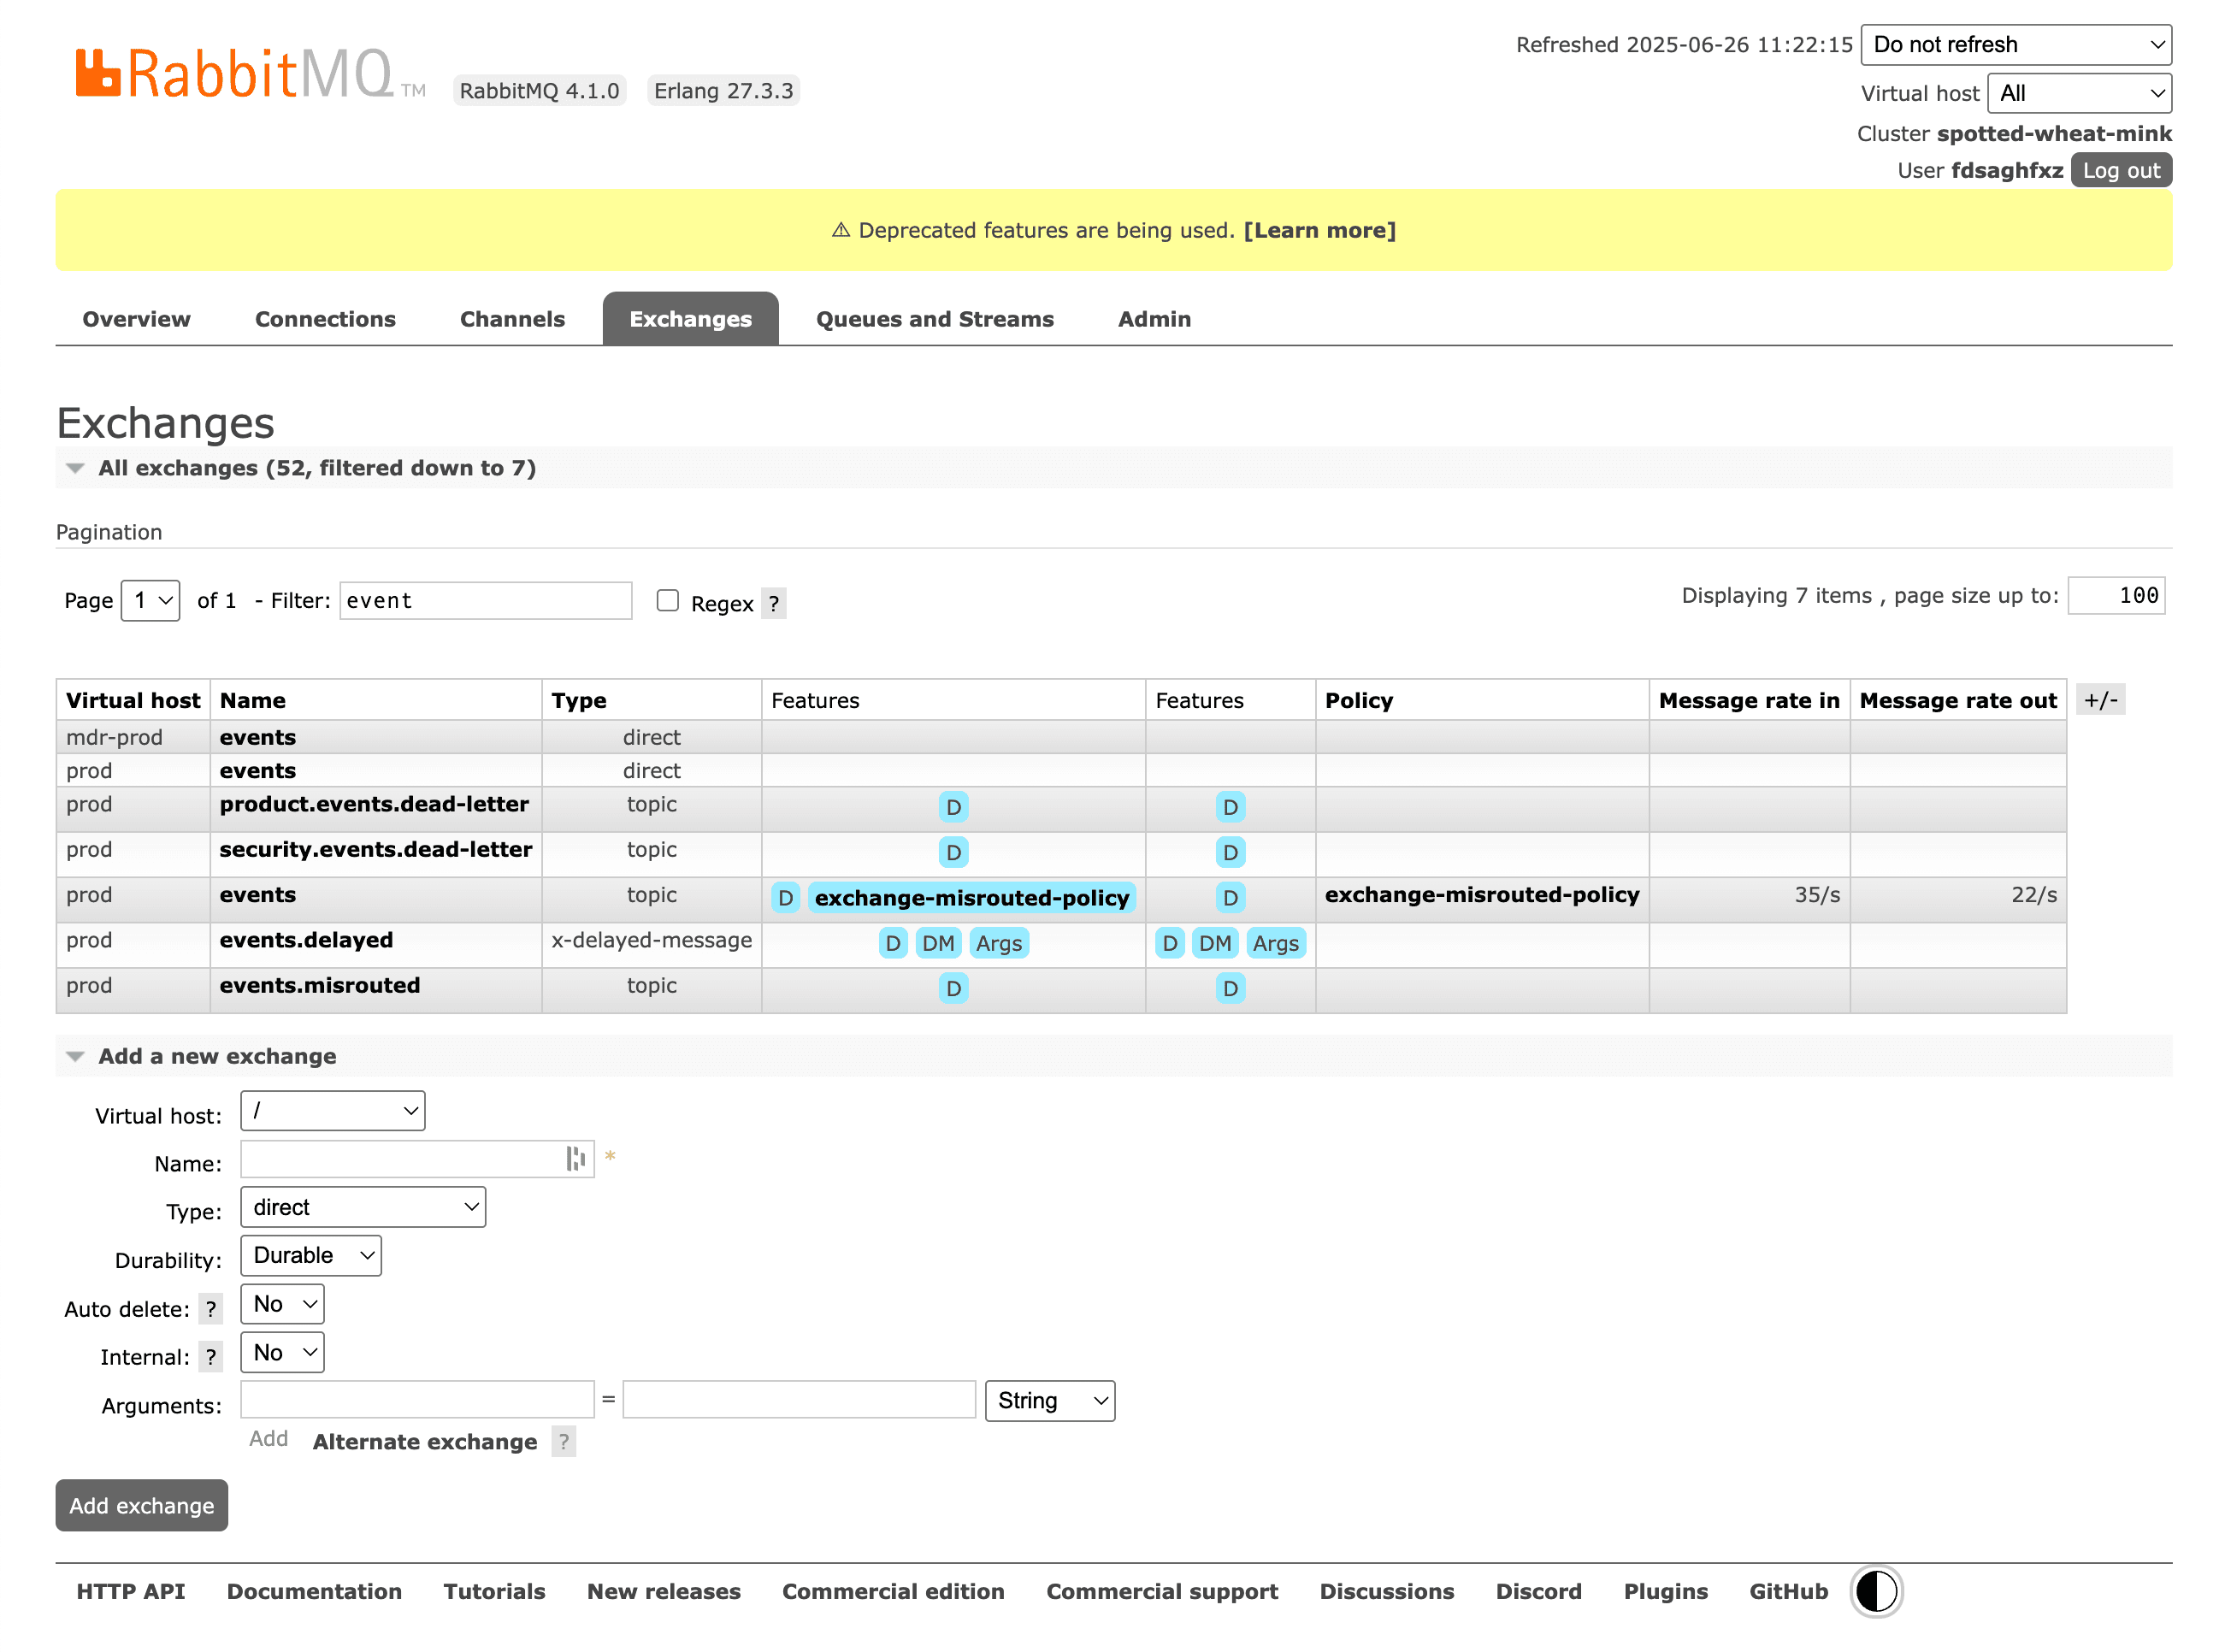
| Visual routing graphSee how exchanges, bindings, dead-letter and alternate exchanges connect. | PartlyBindings listed per exchange or queue, no graph | No |
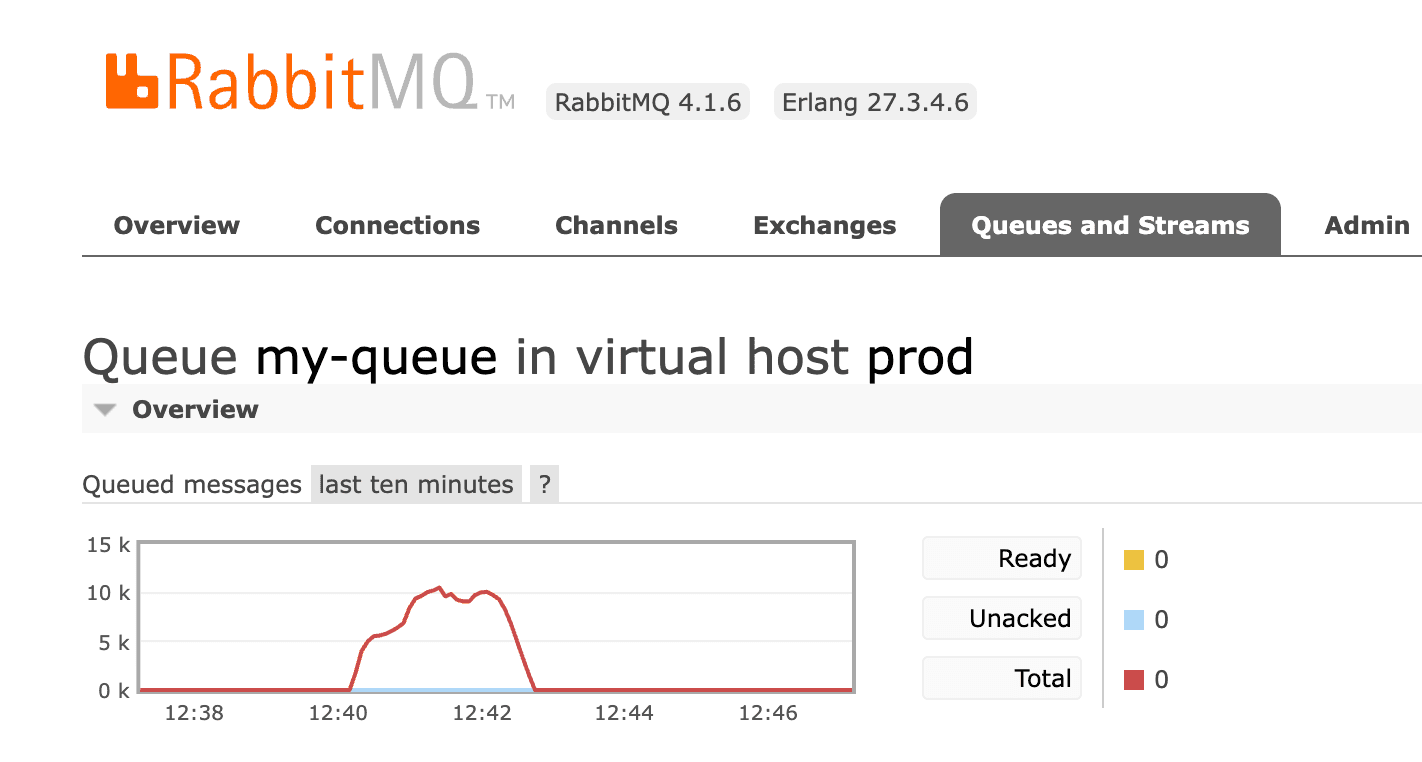
| Metrics & chartsMessage rates, queue depth and other time series. | YesBasic rate and depth charts | YesLong-term metrics, dashboards and alerting |
| Backlog drain forecastEstimate when a queue backlog will be empty. | No | PartlyPossible with PromQL (predict_linear), not built in |
| Many brokers in one placeSwitch between local, staging and production brokers without re-entering credentials. | NoOne broker per browser tab, log in to each | YesMany clusters in one Grafana |
| Bulk actionsAct on many queues or messages at once (purge, delete, move). | No | No |
| Policy debuggingUnderstand which policy applies to a queue and why. | PartlyShows the effective policy of each queue, but not why others did not match | No |
| Other brokersWorks with message brokers other than RabbitMQ (Azure Service Bus, MSMQ, ActiveMQ…). | No | YesAny system with an exporter |
RabbitMQ Management UI: strengths and limitations
The Management UI ships with RabbitMQ as the rabbitmq_management plugin and is served on port 15672. It covers broker administration well: users, vhosts, permissions, policies, queues, exchanges, connections and basic charts.
Strengths
- Free and already installed with most RabbitMQ setups
- Complete administration: users, vhosts, permissions, policies, feature flags
- Officially maintained by the RabbitMQ team
- Works from any browser, nothing to install on your machine
Limitations
- No safe way to browse a queue: "Get messages" is a consume plus requeue
- No message search, filtering or selective replay
- One broker at a time, credentials re-entered per environment
- Slow and cluttered with thousands of queues
Grafana + Prometheus: strengths and limitations
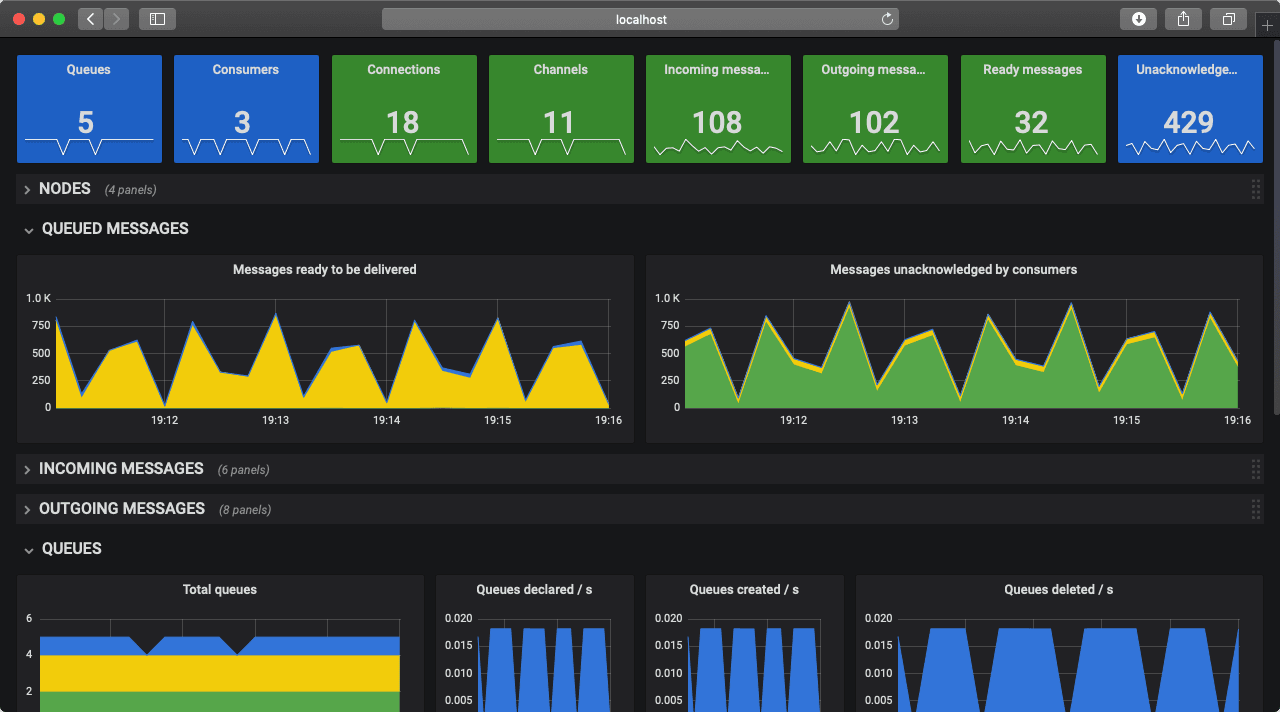
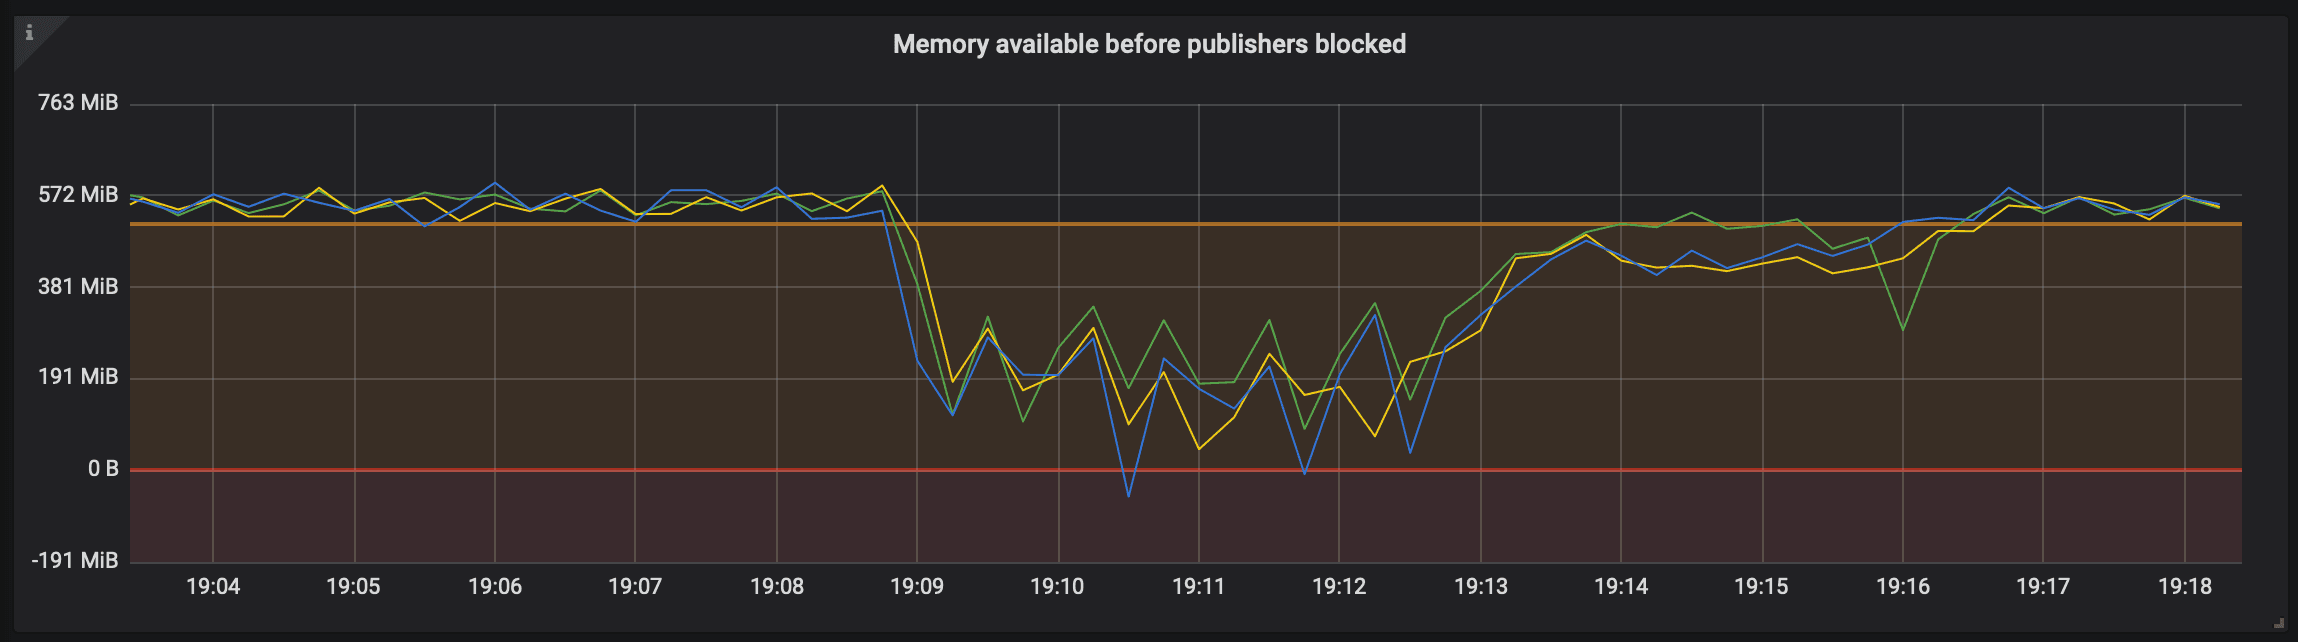
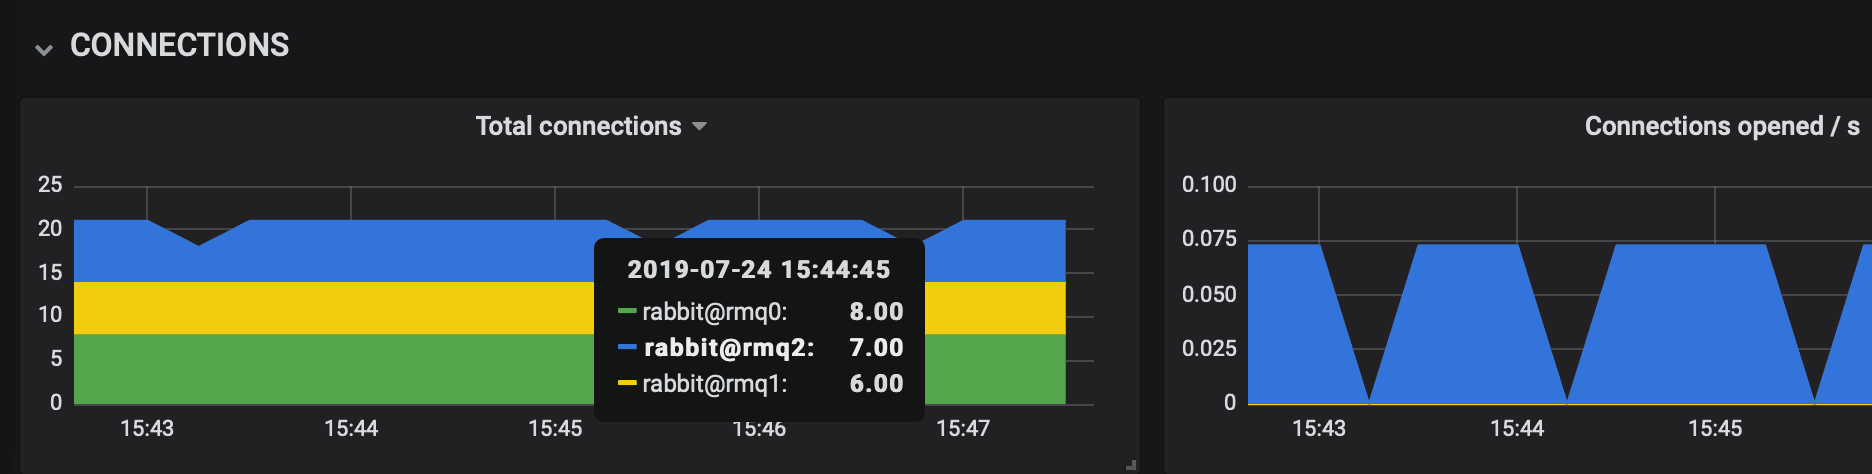
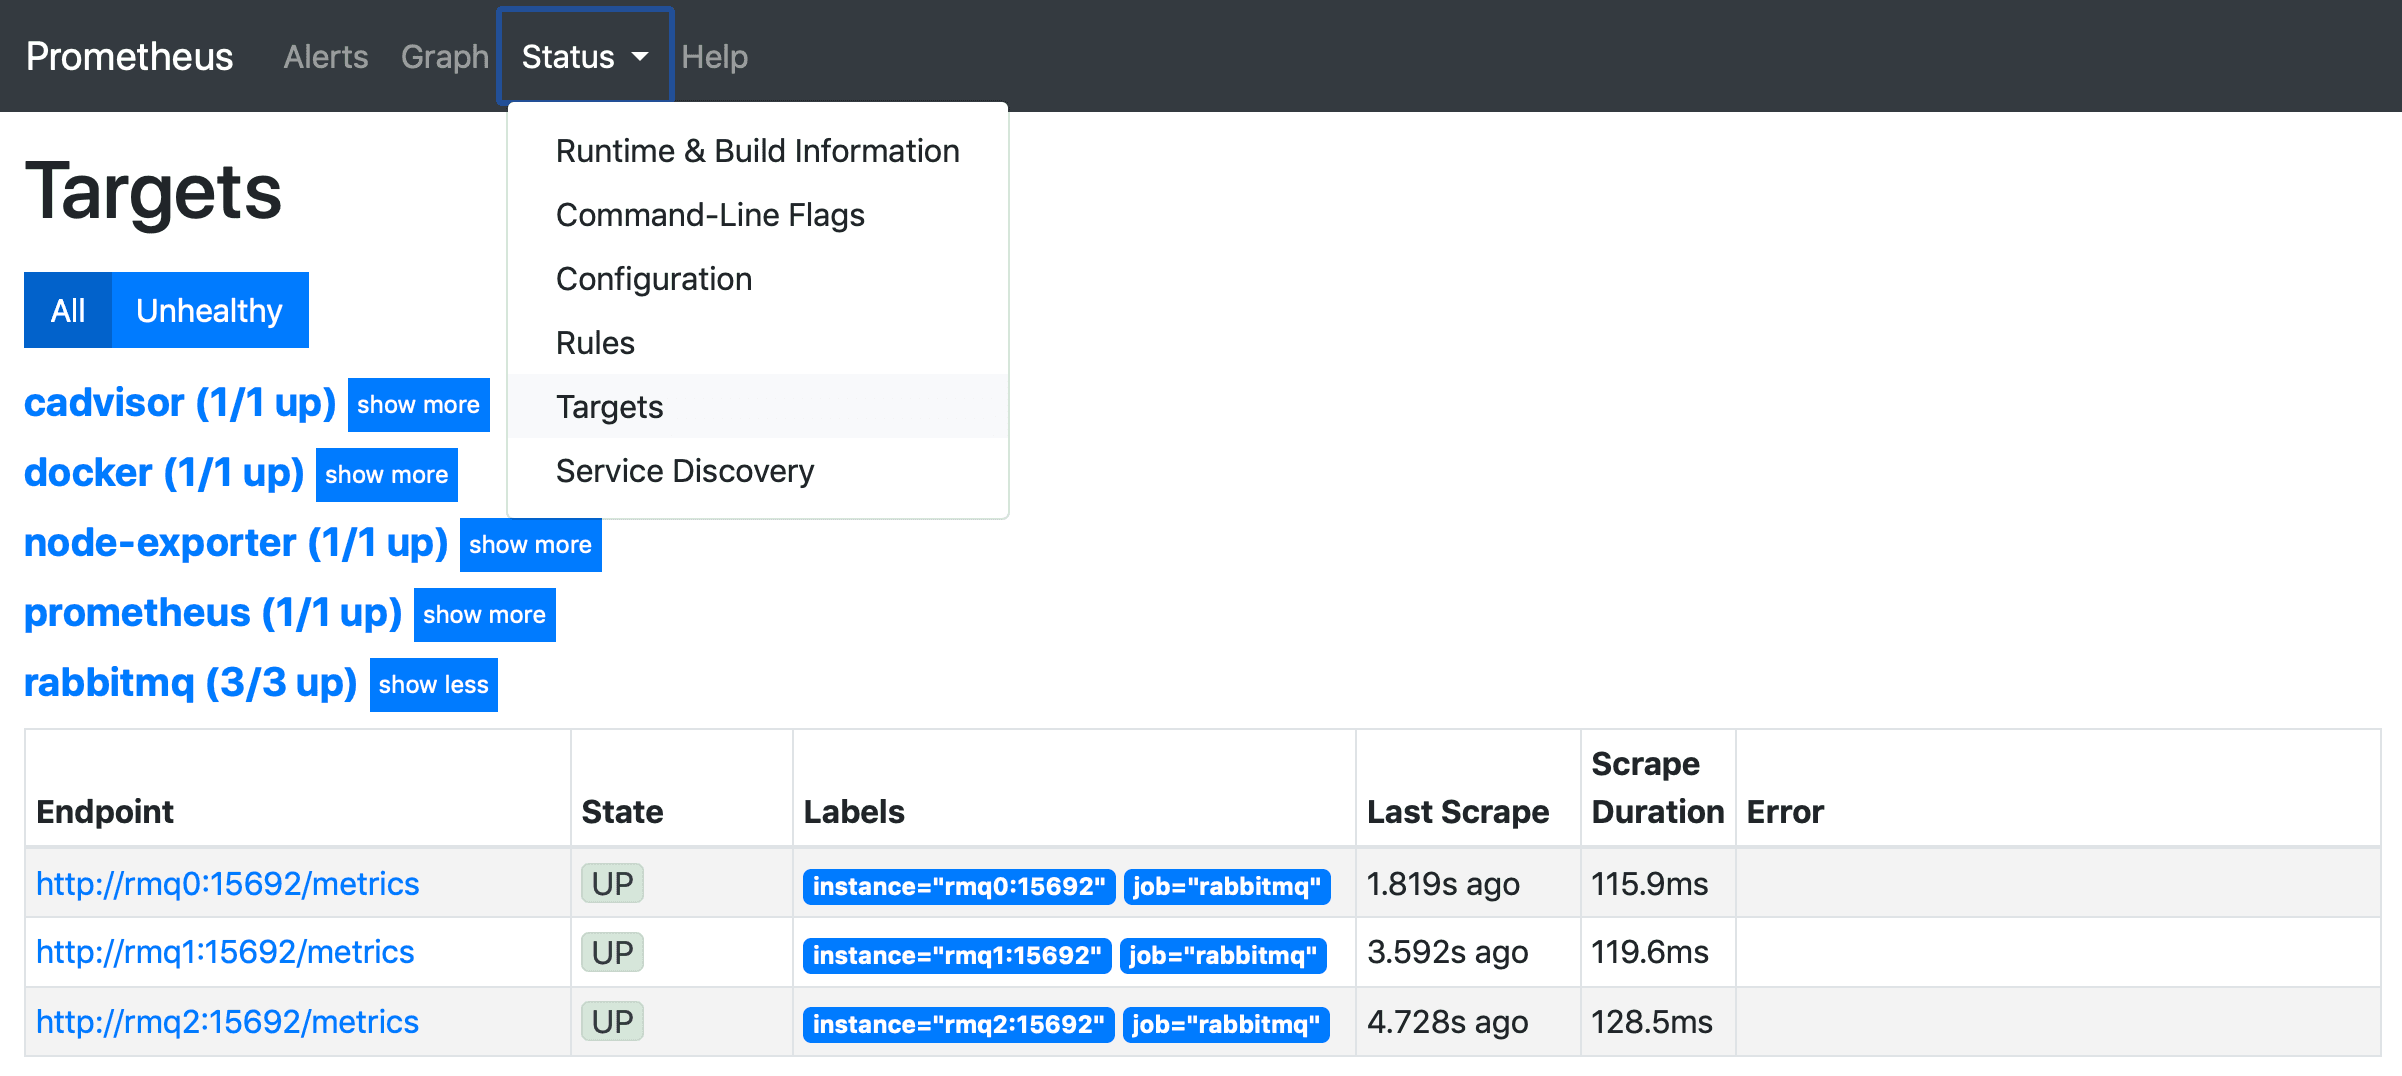
RabbitMQ exposes Prometheus metrics through the rabbitmq_prometheus plugin, and the RabbitMQ team publishes Grafana dashboards for them. This is the go-to stack for long-term metrics, dashboards and alerting, but it does not look at messages.
Strengths
- Best-in-class long-term metrics and alerting
- Official RabbitMQ dashboards available
- One place to monitor RabbitMQ next to the rest of your stack
Limitations
- Metrics only: cannot browse, search or replay messages
- Several components to run and maintain
- Tells you that a queue is growing, not which messages are stuck
Setup and security
RabbitMQ Management UI. Run `rabbitmq-plugins enable rabbitmq_management` (already on in the `-management` Docker images), then open http://localhost:15672. Served by the broker itself. Exposing port 15672 beyond localhost or a VPN needs TLS and proper user tags.
Grafana + Prometheus. Enable rabbitmq_prometheus, scrape port 15692 with Prometheus and import the RabbitMQ dashboards into Grafana. Metrics only, no access to message payloads.
Pricing
- RabbitMQ Management UI: Free (bundled with RabbitMQ)
- Grafana + Prometheus: Free (open source), Grafana Cloud has paid tiers
Should you choose Management UI or Grafana?
Choose RabbitMQ Management UI if…
You need administration and a quick live look.
Choose Grafana + Prometheus if…
You need production monitoring, history and alerts.
A third option: RabbitGUI
If what you really need is to debug messages (browse a queue without losing anything, filter and replay dead letters, watch live traffic), RabbitGUI is a native desktop app built for exactly that. Compare it with RabbitMQ Management UI and Grafana + Prometheus.
FAQ
Yes. Free (bundled with RabbitMQ).
Yes. Free (open source), Grafana Cloud has paid tiers.
Yes, each one connects to your broker independently. A common split is Management UI when you need administration and a quick live look, and Grafana when you need production monitoring, history and alerts.
RabbitMQ Management UI: yes (Any browser). Grafana + Prometheus: yes (Self-hosted or Grafana Cloud, any browser).
Neither offers a full replay workflow. A desktop client such as RabbitGUI lets you filter and republish dead letters selectively.
Related comparisons
Facts last verified on 2026-11-02. Sources: RabbitMQ docs: Management Plugin, RabbitMQ docs: Prometheus and Grafana. Spotted something outdated? Email nicolas@tggl.io and we will fix it.