RabbitGUI vs Grafana + Prometheus
An honest, feature-by-feature comparison of RabbitGUI and Grafana + Prometheus: message browsing, dead letters, live traffic, platforms and pricing.
Quick verdict
Grafana and Prometheus tell you that something is wrong: a queue is growing, consumers disappeared. RabbitGUI tells you what is wrong: which messages are stuck, why they were dead-lettered, and where they are routed. Run Grafana for alerting and reach for RabbitGUI when an alert fires.
Disclosure: we make RabbitGUI. We list where the other tool is the better choice, and every competitor fact links to its source.
At a glance
| RabbitGUI | Grafana + Prometheus | |
|---|---|---|
| Type | Desktop app | Monitoring stack |
| Runs on | macOS, Windows, Linux | Self-hosted or Grafana Cloud, any browser |
| Price | 29€ one-time, free updates forever | Free (open source), Grafana Cloud has paid tiers |
| Open source | No | Yes (AGPL-3.0 (Grafana), Apache-2.0 (Prometheus)) |
| Made by | RabbitGUI | Grafana Labs / Prometheus (open source) |
| Best for | Developers who debug RabbitMQ queues, messages and dead letters regularly and want a fast desktop tool. | Production monitoring and alerting across clusters, as a complement to a debugging tool. |
Feature by feature
| Capability | RabbitGUI | Grafana |
|---|---|---|
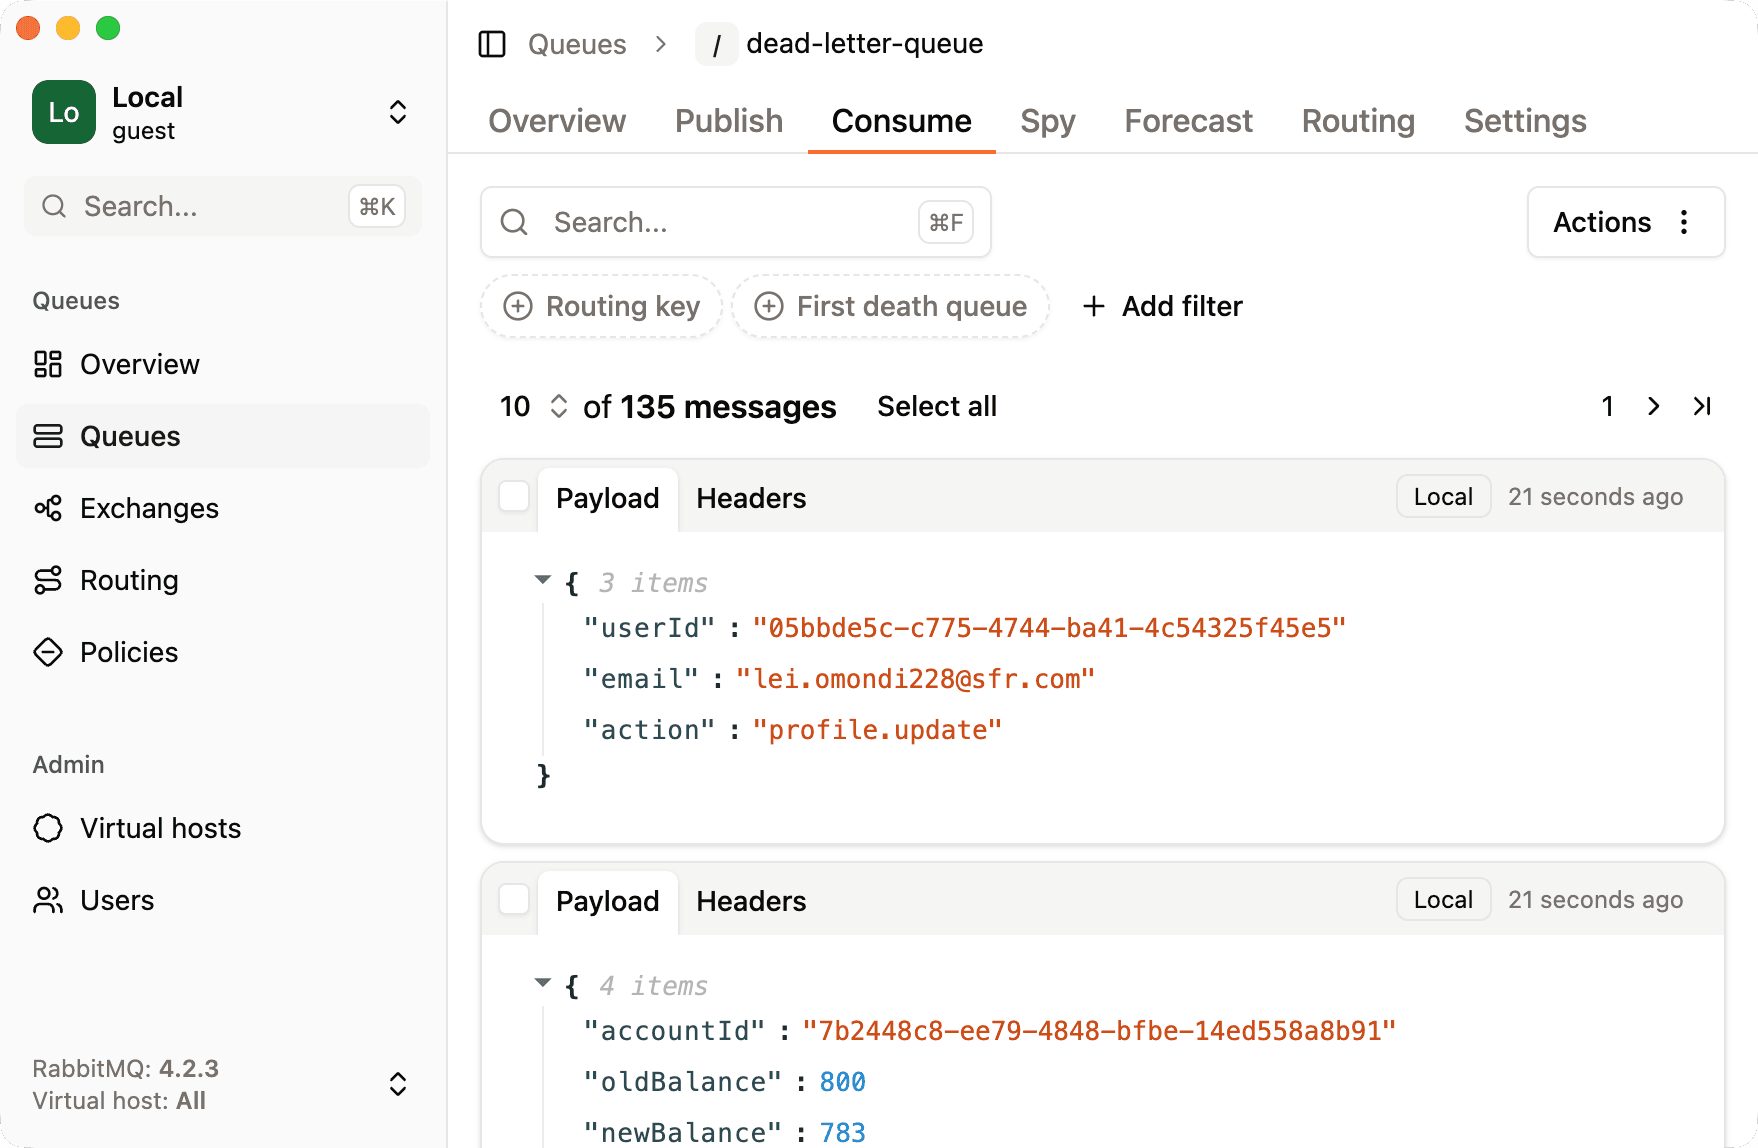
| Browse messages safelyLook at the messages sitting in a queue without losing them or disturbing consumers. | YesCopies messages to a local store, with requeue or removal, then lets you inspect them at no cost to the broker | No |
| Search & filter messagesFind specific messages by body, headers or properties instead of paging through them one by one. | YesSearch and filter extracted messages | No |
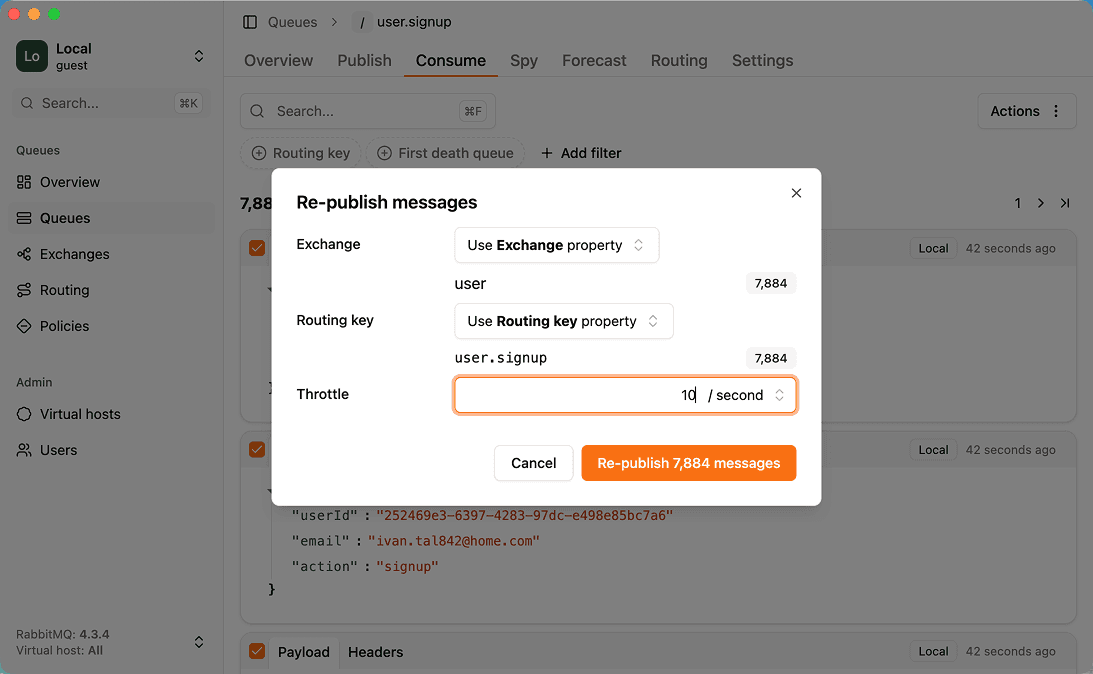
| Replay dead lettersRe-publish failed or dead-lettered messages back to a queue or exchange. | YesRepublish selected messages anywhere, with throttling | No |
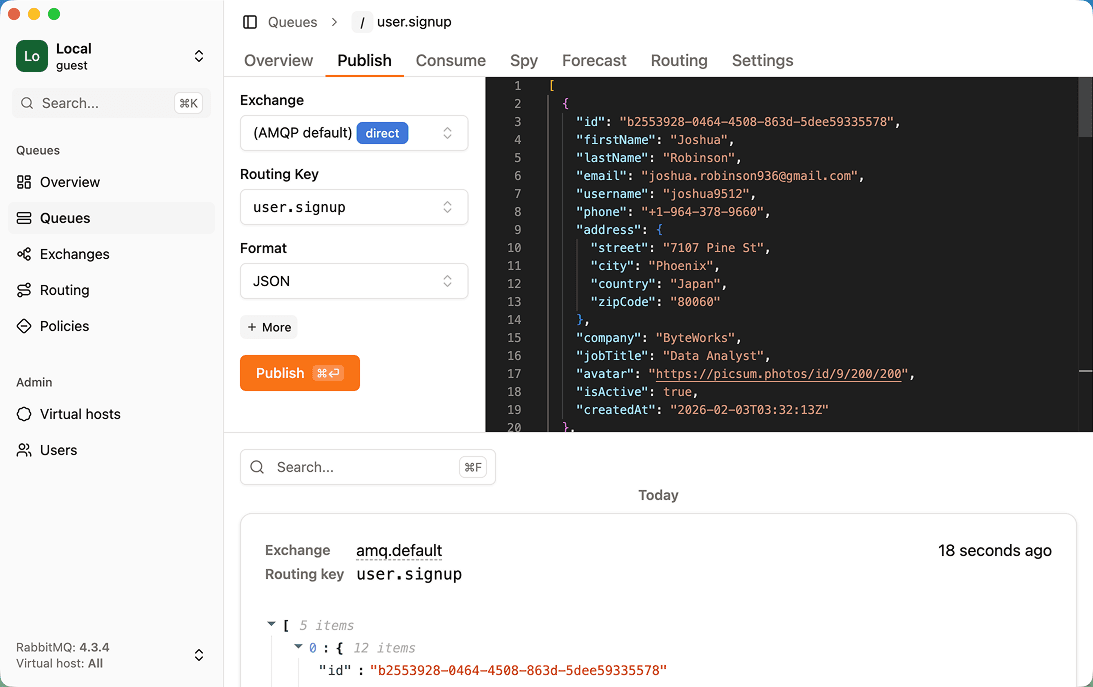
| Publish test messagesSend a message with custom headers and properties by hand. | YesVS Code-style JSON editor | No |
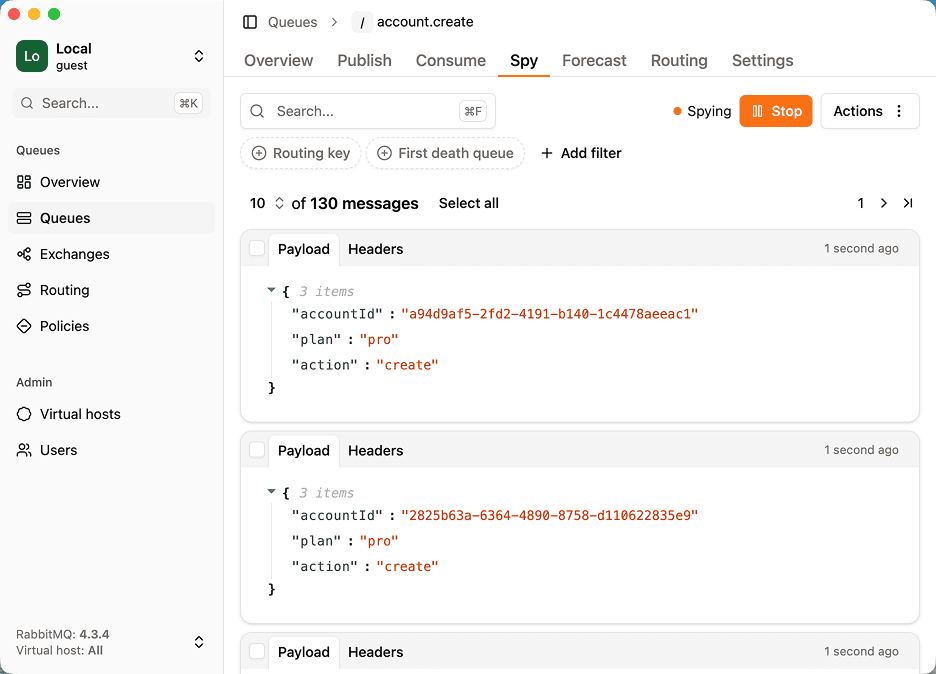
| Watch live trafficSee messages as they flow through a queue without consuming them. | YesNon-destructive spy using a temporary shadow queue | No |
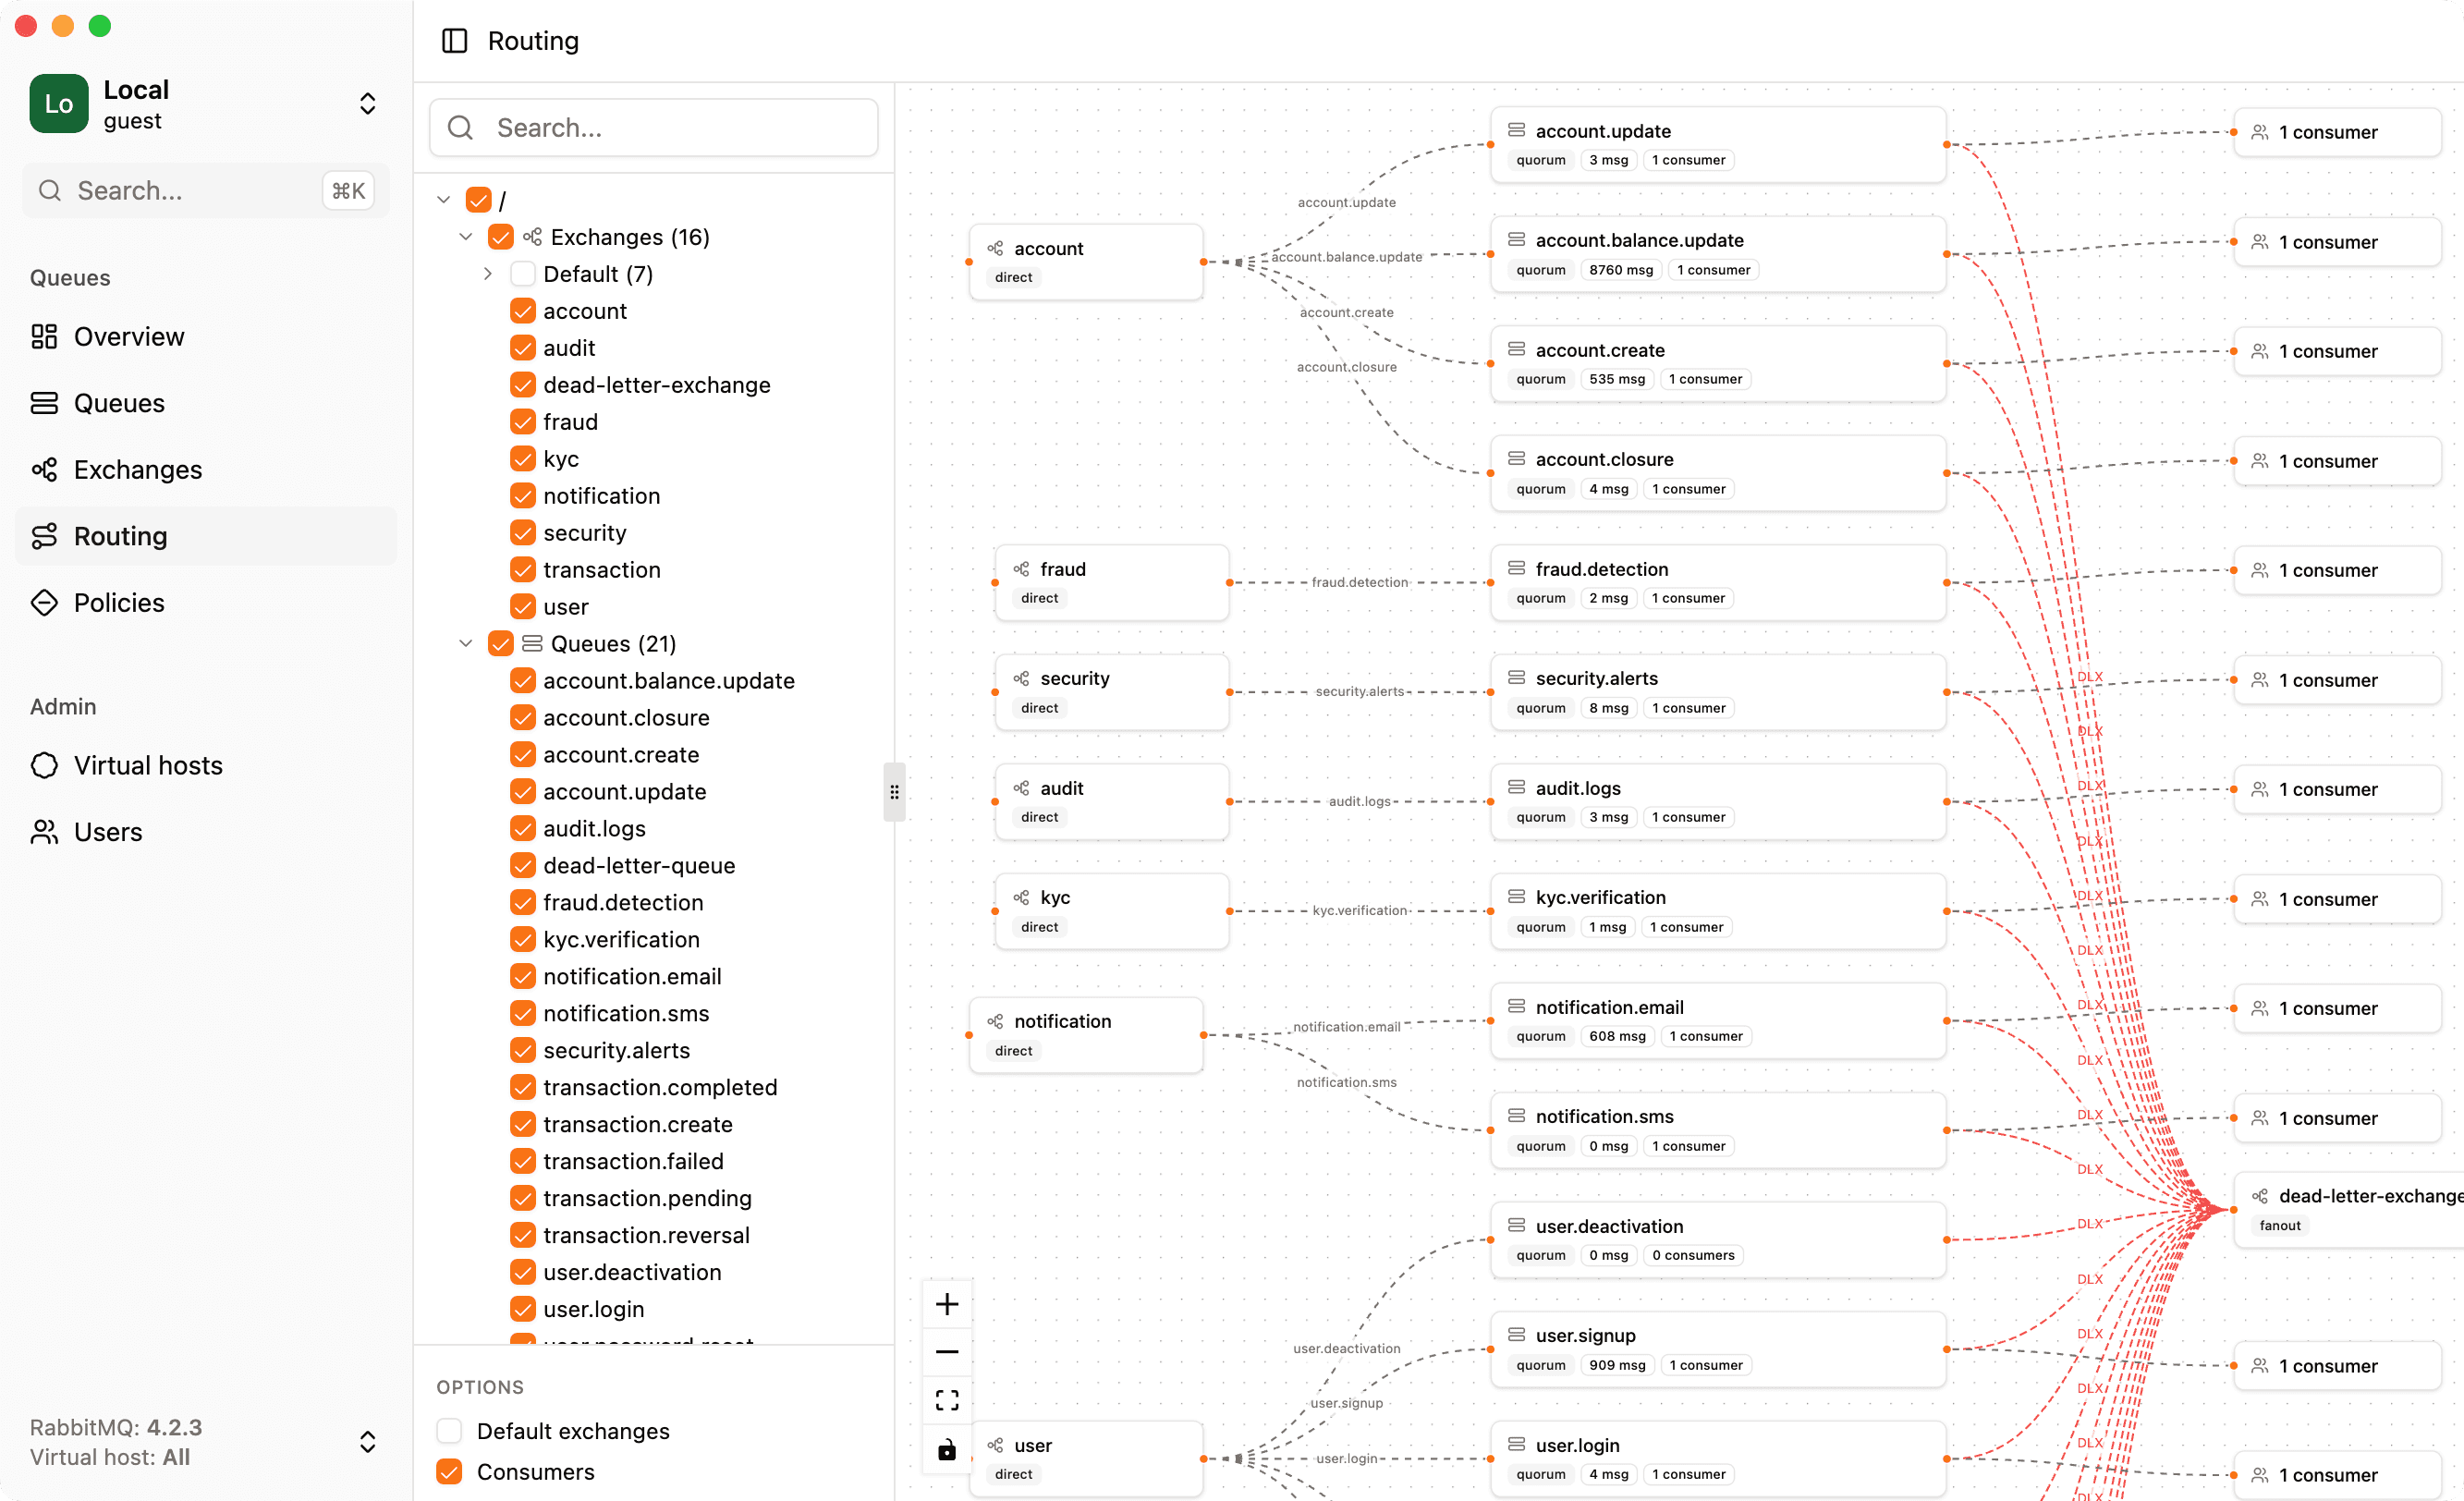
| Visual routing graphSee how exchanges, bindings, dead-letter and alternate exchanges connect. | YesInteractive graph including dead-letter and alternate exchanges | No |
| Metrics & chartsMessage rates, queue depth and other time series. | YesTime series explorer with zoom | YesLong-term metrics, dashboards and alerting |
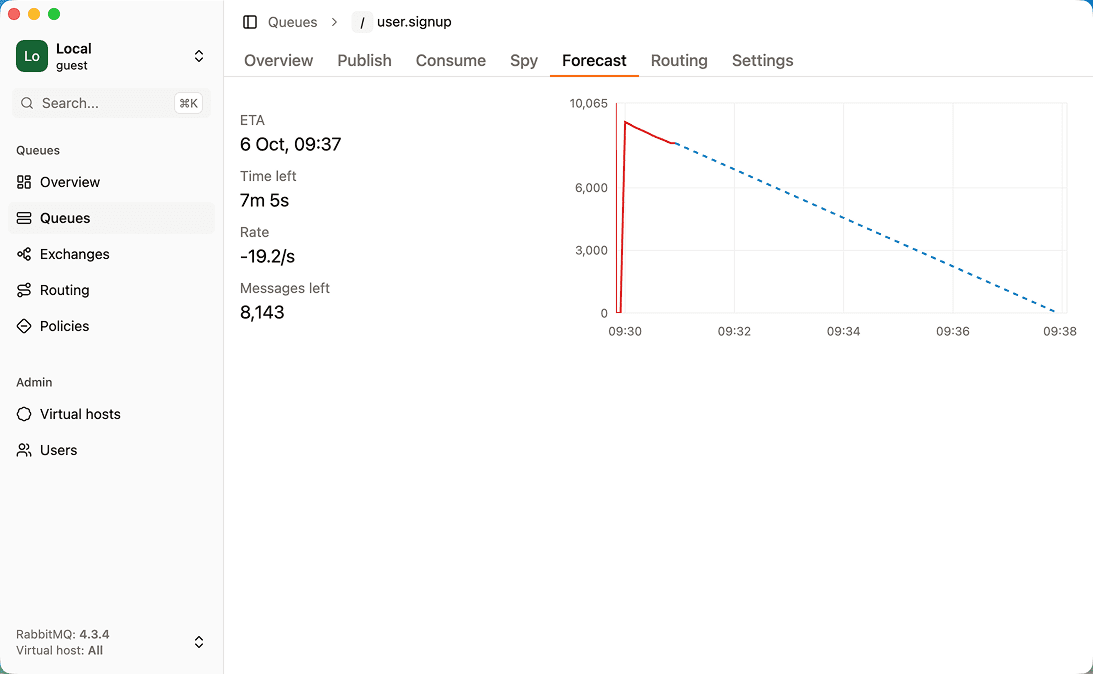
| Backlog drain forecastEstimate when a queue backlog will be empty. | YesDrain-time estimate based on linear regression | PartlyPossible with PromQL (predict_linear), not built in |
| Many brokers in one placeSwitch between local, staging and production brokers without re-entering credentials. | YesOne-click switching | YesMany clusters in one Grafana |
| Bulk actionsAct on many queues or messages at once (purge, delete, move). | YesBulk purge and other bulk actions | No |
| Policy debuggingUnderstand which policy applies to a queue and why. | YesDedicated policy debugger | No |
| Other brokersWorks with message brokers other than RabbitMQ (Azure Service Bus, MSMQ, ActiveMQ…). | NoRabbitMQ only | YesAny system with an exporter |
RabbitGUI: strengths and limitations
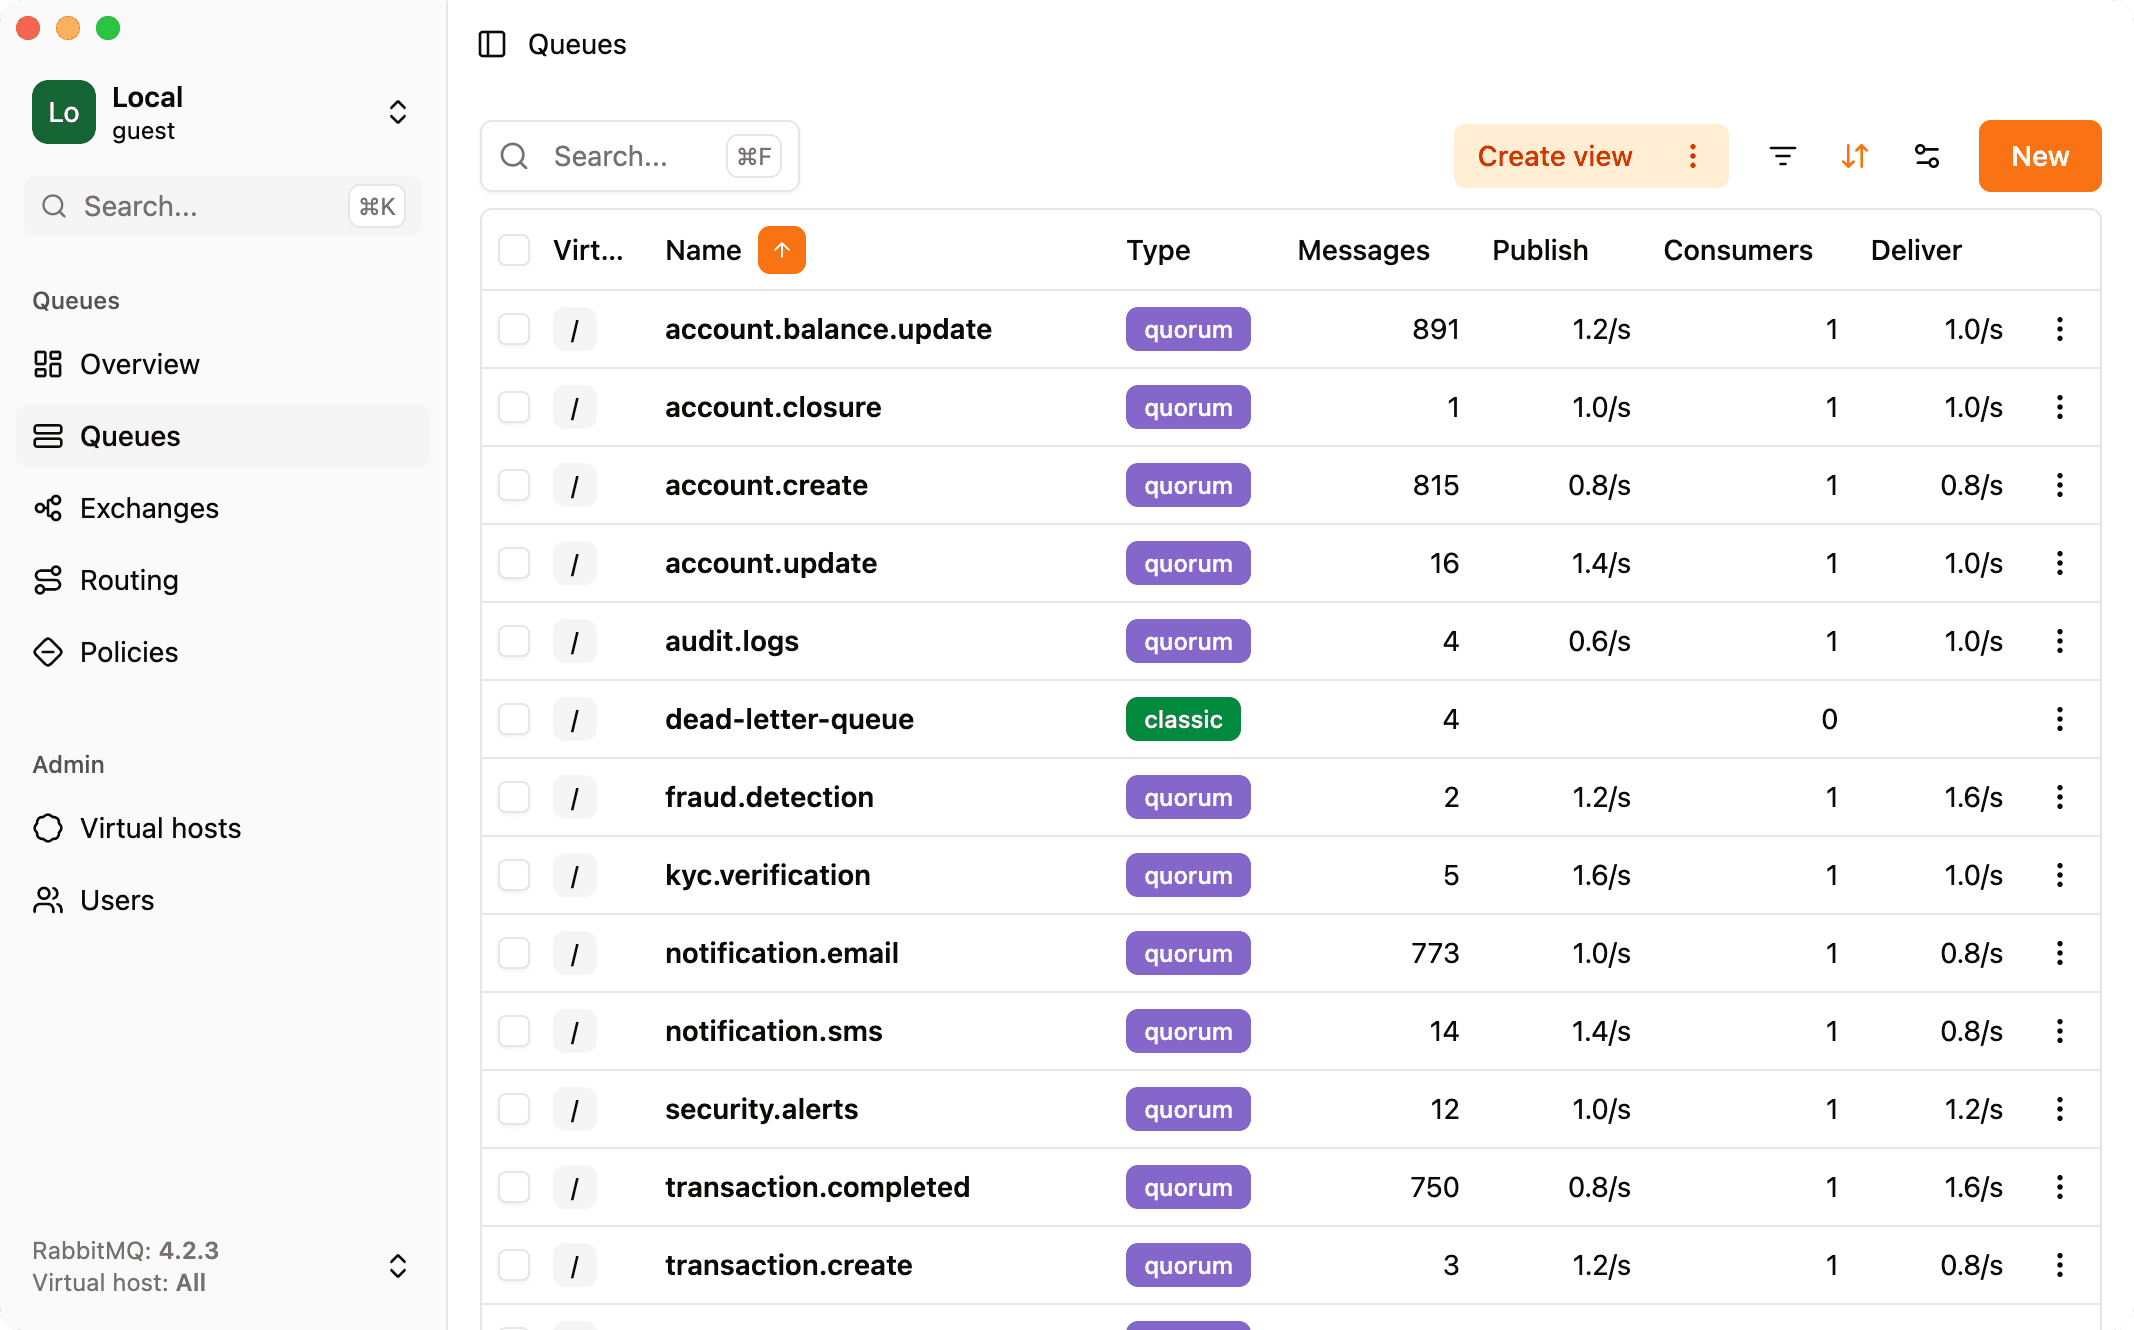
RabbitGUI is a desktop app for macOS, Windows and Linux that connects to your brokers through the management API. It focuses on day-to-day debugging: browsing and filtering messages, replaying dead letters, spying on live traffic, and visualizing routing.
Strengths
- Dead-letter workflow: inspect, filter and republish failed messages with throttling
- Non-destructive live spy on any queue
- Routing graph, drain-time forecast and policy debugger are unique among RabbitMQ tools
- Native app on macOS, Windows and Linux with nothing to deploy
- Low one-time price with free updates forever and a 30-day refund
Limitations
- Paid (no free tier or trial, a 30-day money-back guarantee instead)
- RabbitMQ only
- Needs the management plugin enabled, like most RabbitMQ tools
- Not a team-wide always-on dashboard: it runs on each developer machine
Grafana + Prometheus: strengths and limitations
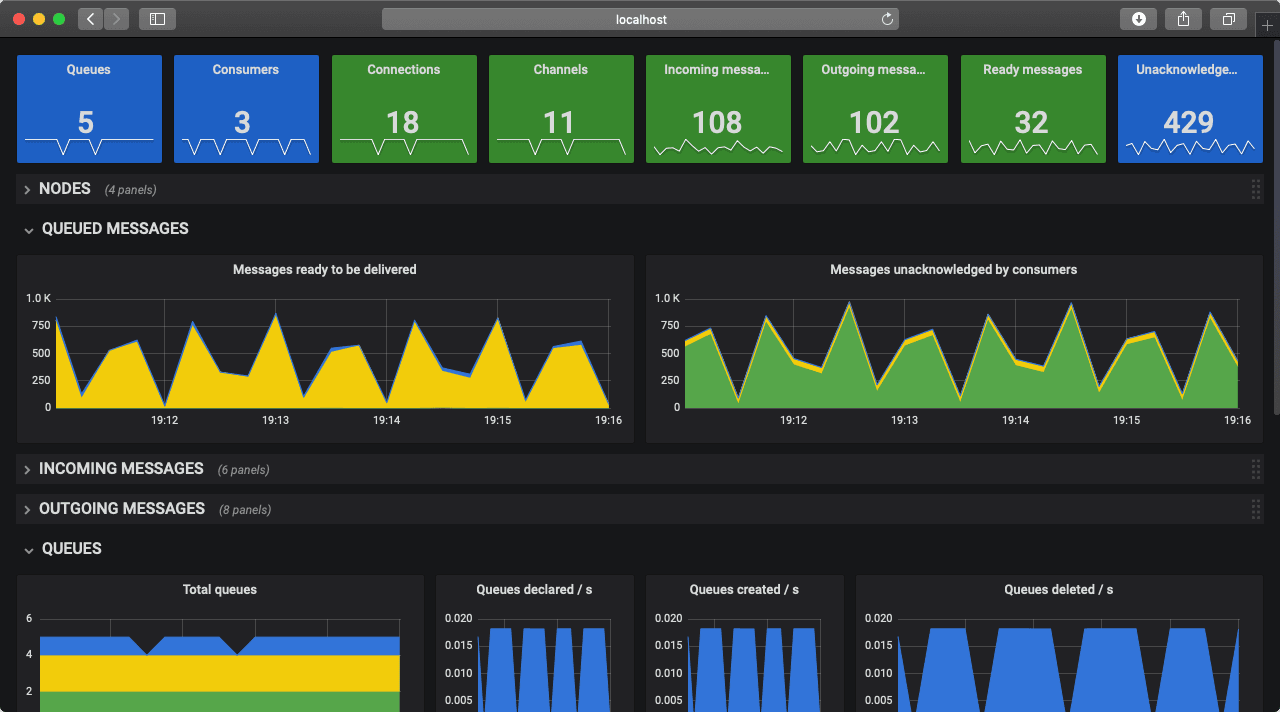
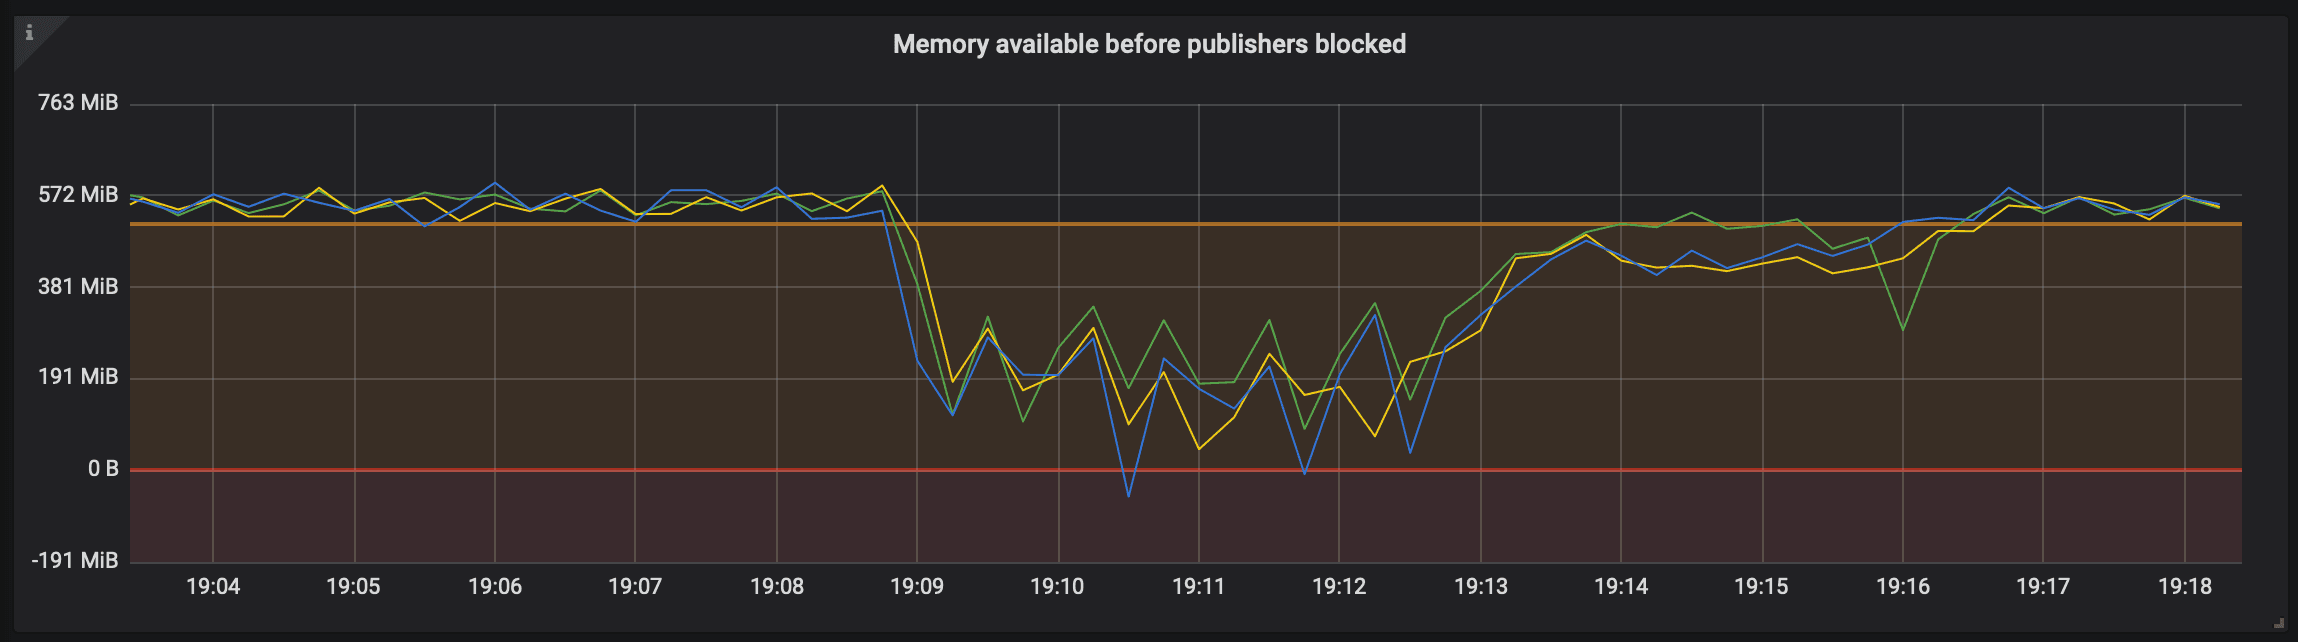
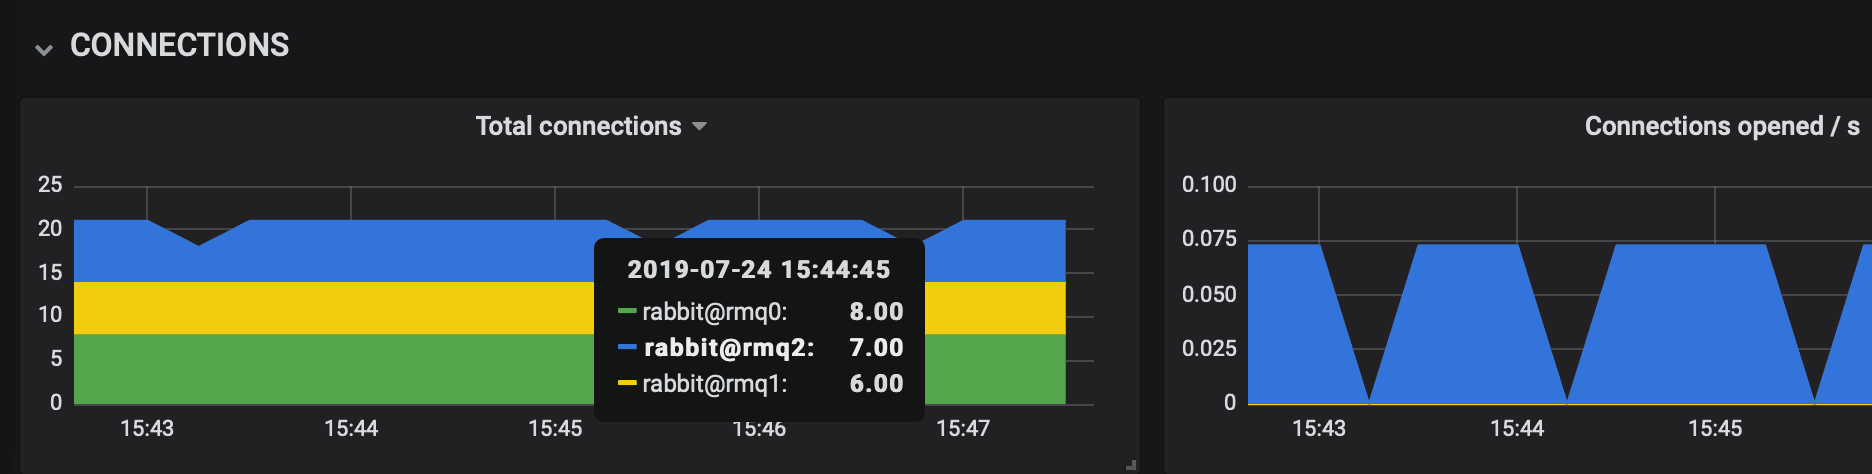
RabbitMQ exposes Prometheus metrics through the rabbitmq_prometheus plugin, and the RabbitMQ team publishes Grafana dashboards for them. This is the go-to stack for long-term metrics, dashboards and alerting, but it does not look at messages.
Strengths
- Best-in-class long-term metrics and alerting
- Official RabbitMQ dashboards available
- One place to monitor RabbitMQ next to the rest of your stack
Limitations
- Metrics only: cannot browse, search or replay messages
- Several components to run and maintain
- Tells you that a queue is growing, not which messages are stuck
Setup and security
RabbitGUI. Install the desktop app and add a connection (management URL, credentials, optional AMQP URI). Nothing to deploy next to the broker. Runs locally and talks directly to your broker. No server in the middle, credentials stay on your machine.
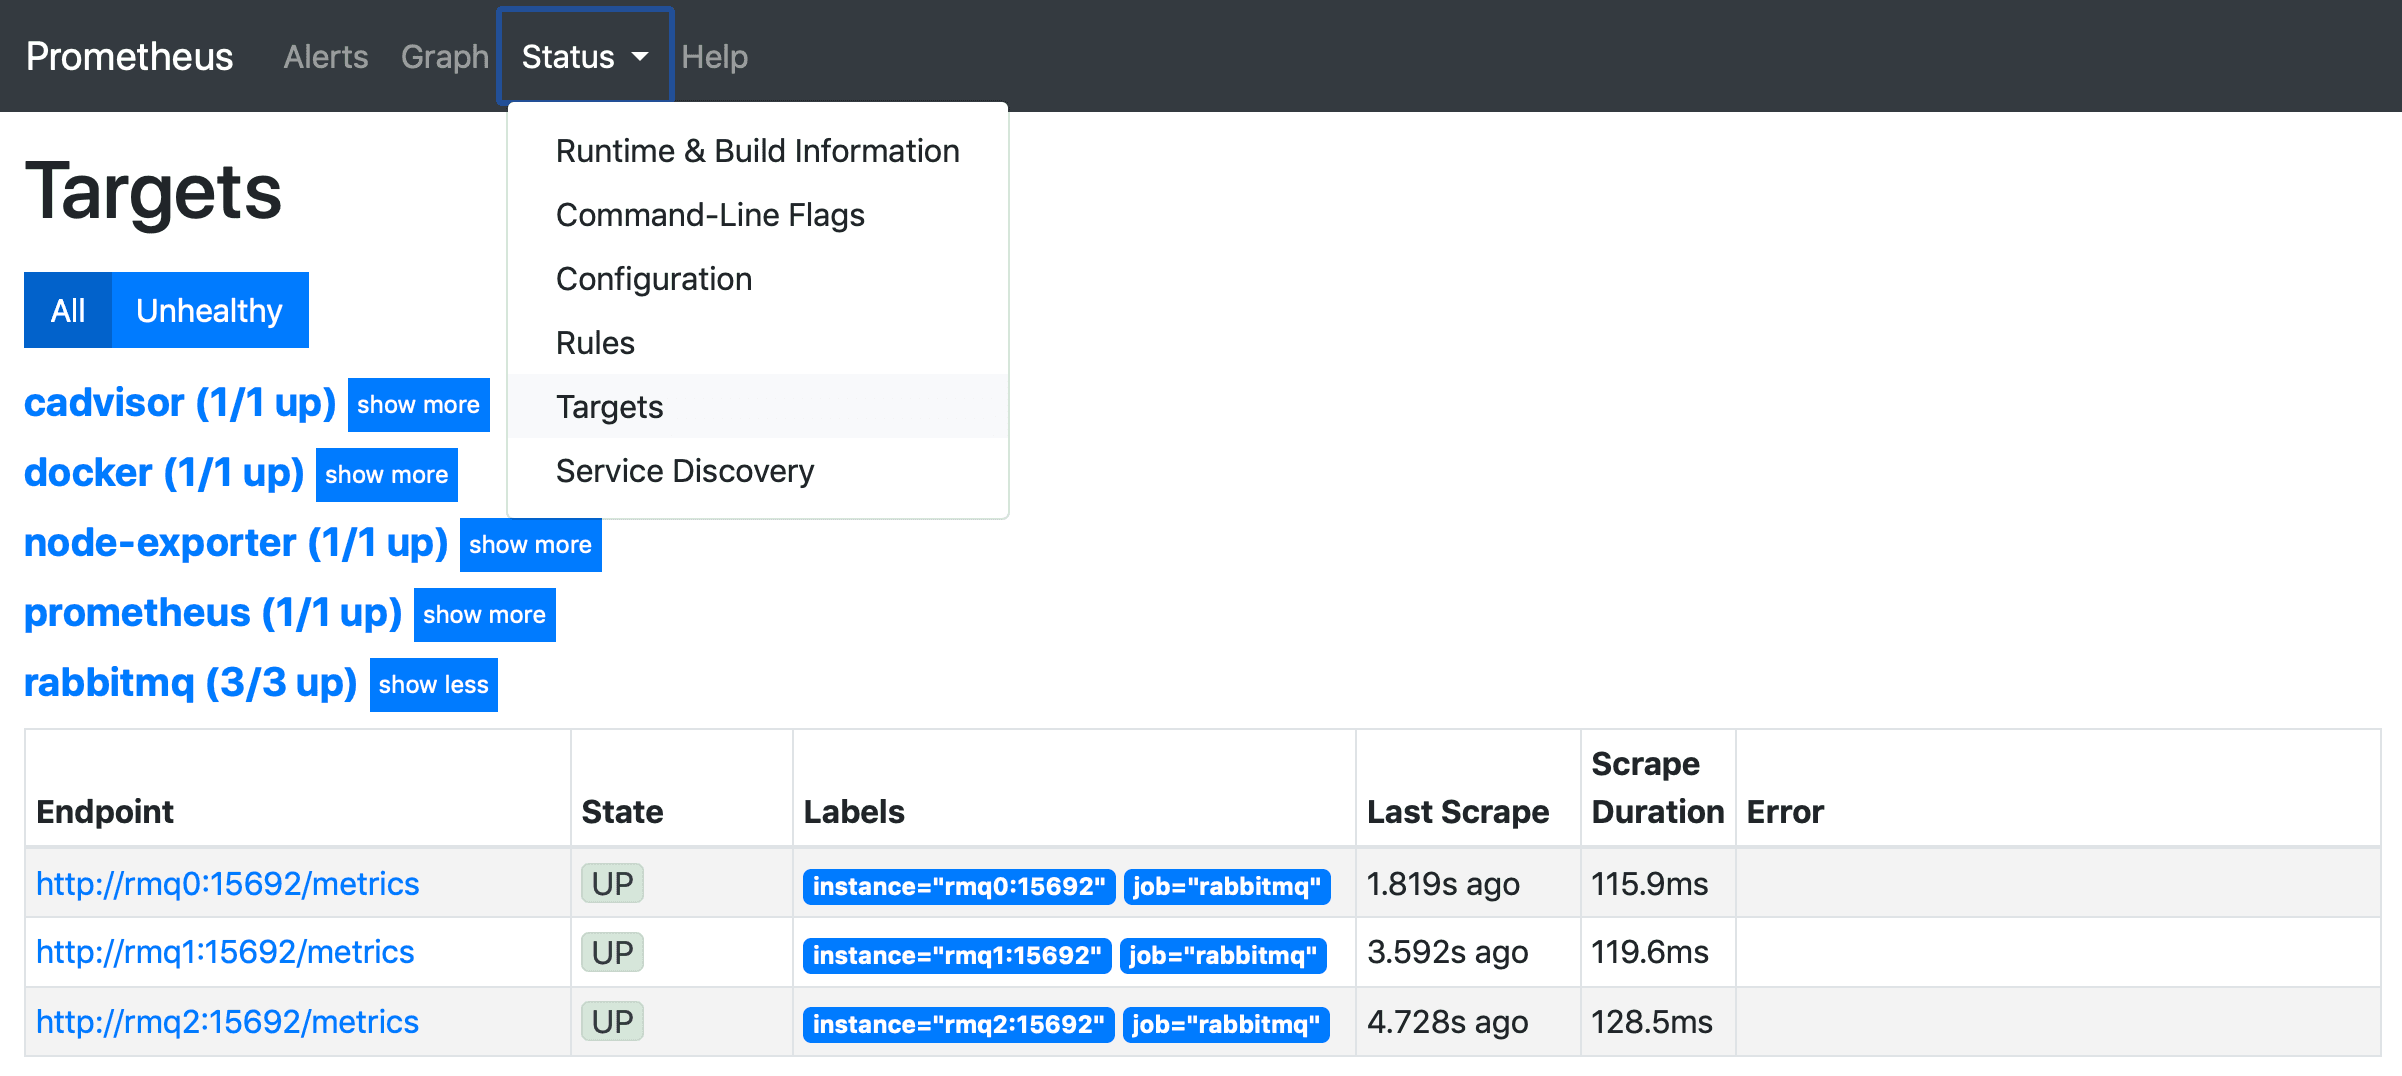
Grafana + Prometheus. Enable rabbitmq_prometheus, scrape port 15692 with Prometheus and import the RabbitMQ dashboards into Grafana. Metrics only, no access to message payloads.
Pricing
- RabbitGUI: 29€ one-time, free updates forever
- Grafana + Prometheus: Free (open source), Grafana Cloud has paid tiers
Should you choose RabbitGUI or Grafana?
Choose RabbitGUI if…
You need to look at the actual messages, routing and dead letters.
Choose Grafana + Prometheus if…
You need long-term metrics, dashboards and alerting across clusters.
FAQ
No. RabbitGUI costs 29€ one-time, free updates forever.
Yes. Free (open source), Grafana Cloud has paid tiers.
Yes, each one connects to your broker independently. A common split is RabbitGUI when you need to look at the actual messages, routing and dead letters, and Grafana when you need long-term metrics, dashboards and alerting across clusters.
RabbitGUI: yes (macOS, Windows, Linux). Grafana + Prometheus: yes (Self-hosted or Grafana Cloud, any browser).
RabbitGUI lets you inspect and republish dead-lettered messages, while Grafana + Prometheus does not offer a replay workflow.
Related comparisons
Facts last verified on 2026-11-02. Sources: rabbitgui.com, RabbitMQ docs: Prometheus and Grafana. Spotted something outdated? Email nicolas@tggl.io and we will fix it.